Evaluating Consumption Disparities and the Gini Index Limitations
Source:The Hindu ↗
Why It Matters
Understanding the nuances of economic metrics like the Gini coefficient and Lorenz curve is critical for both Prelims and Mains (GS3). The article bridges economic theory with socio-economic realities (GS2), making it highly relevant for essays and answers on inclusive development, women's empowerment, and poverty estimation.
Summary
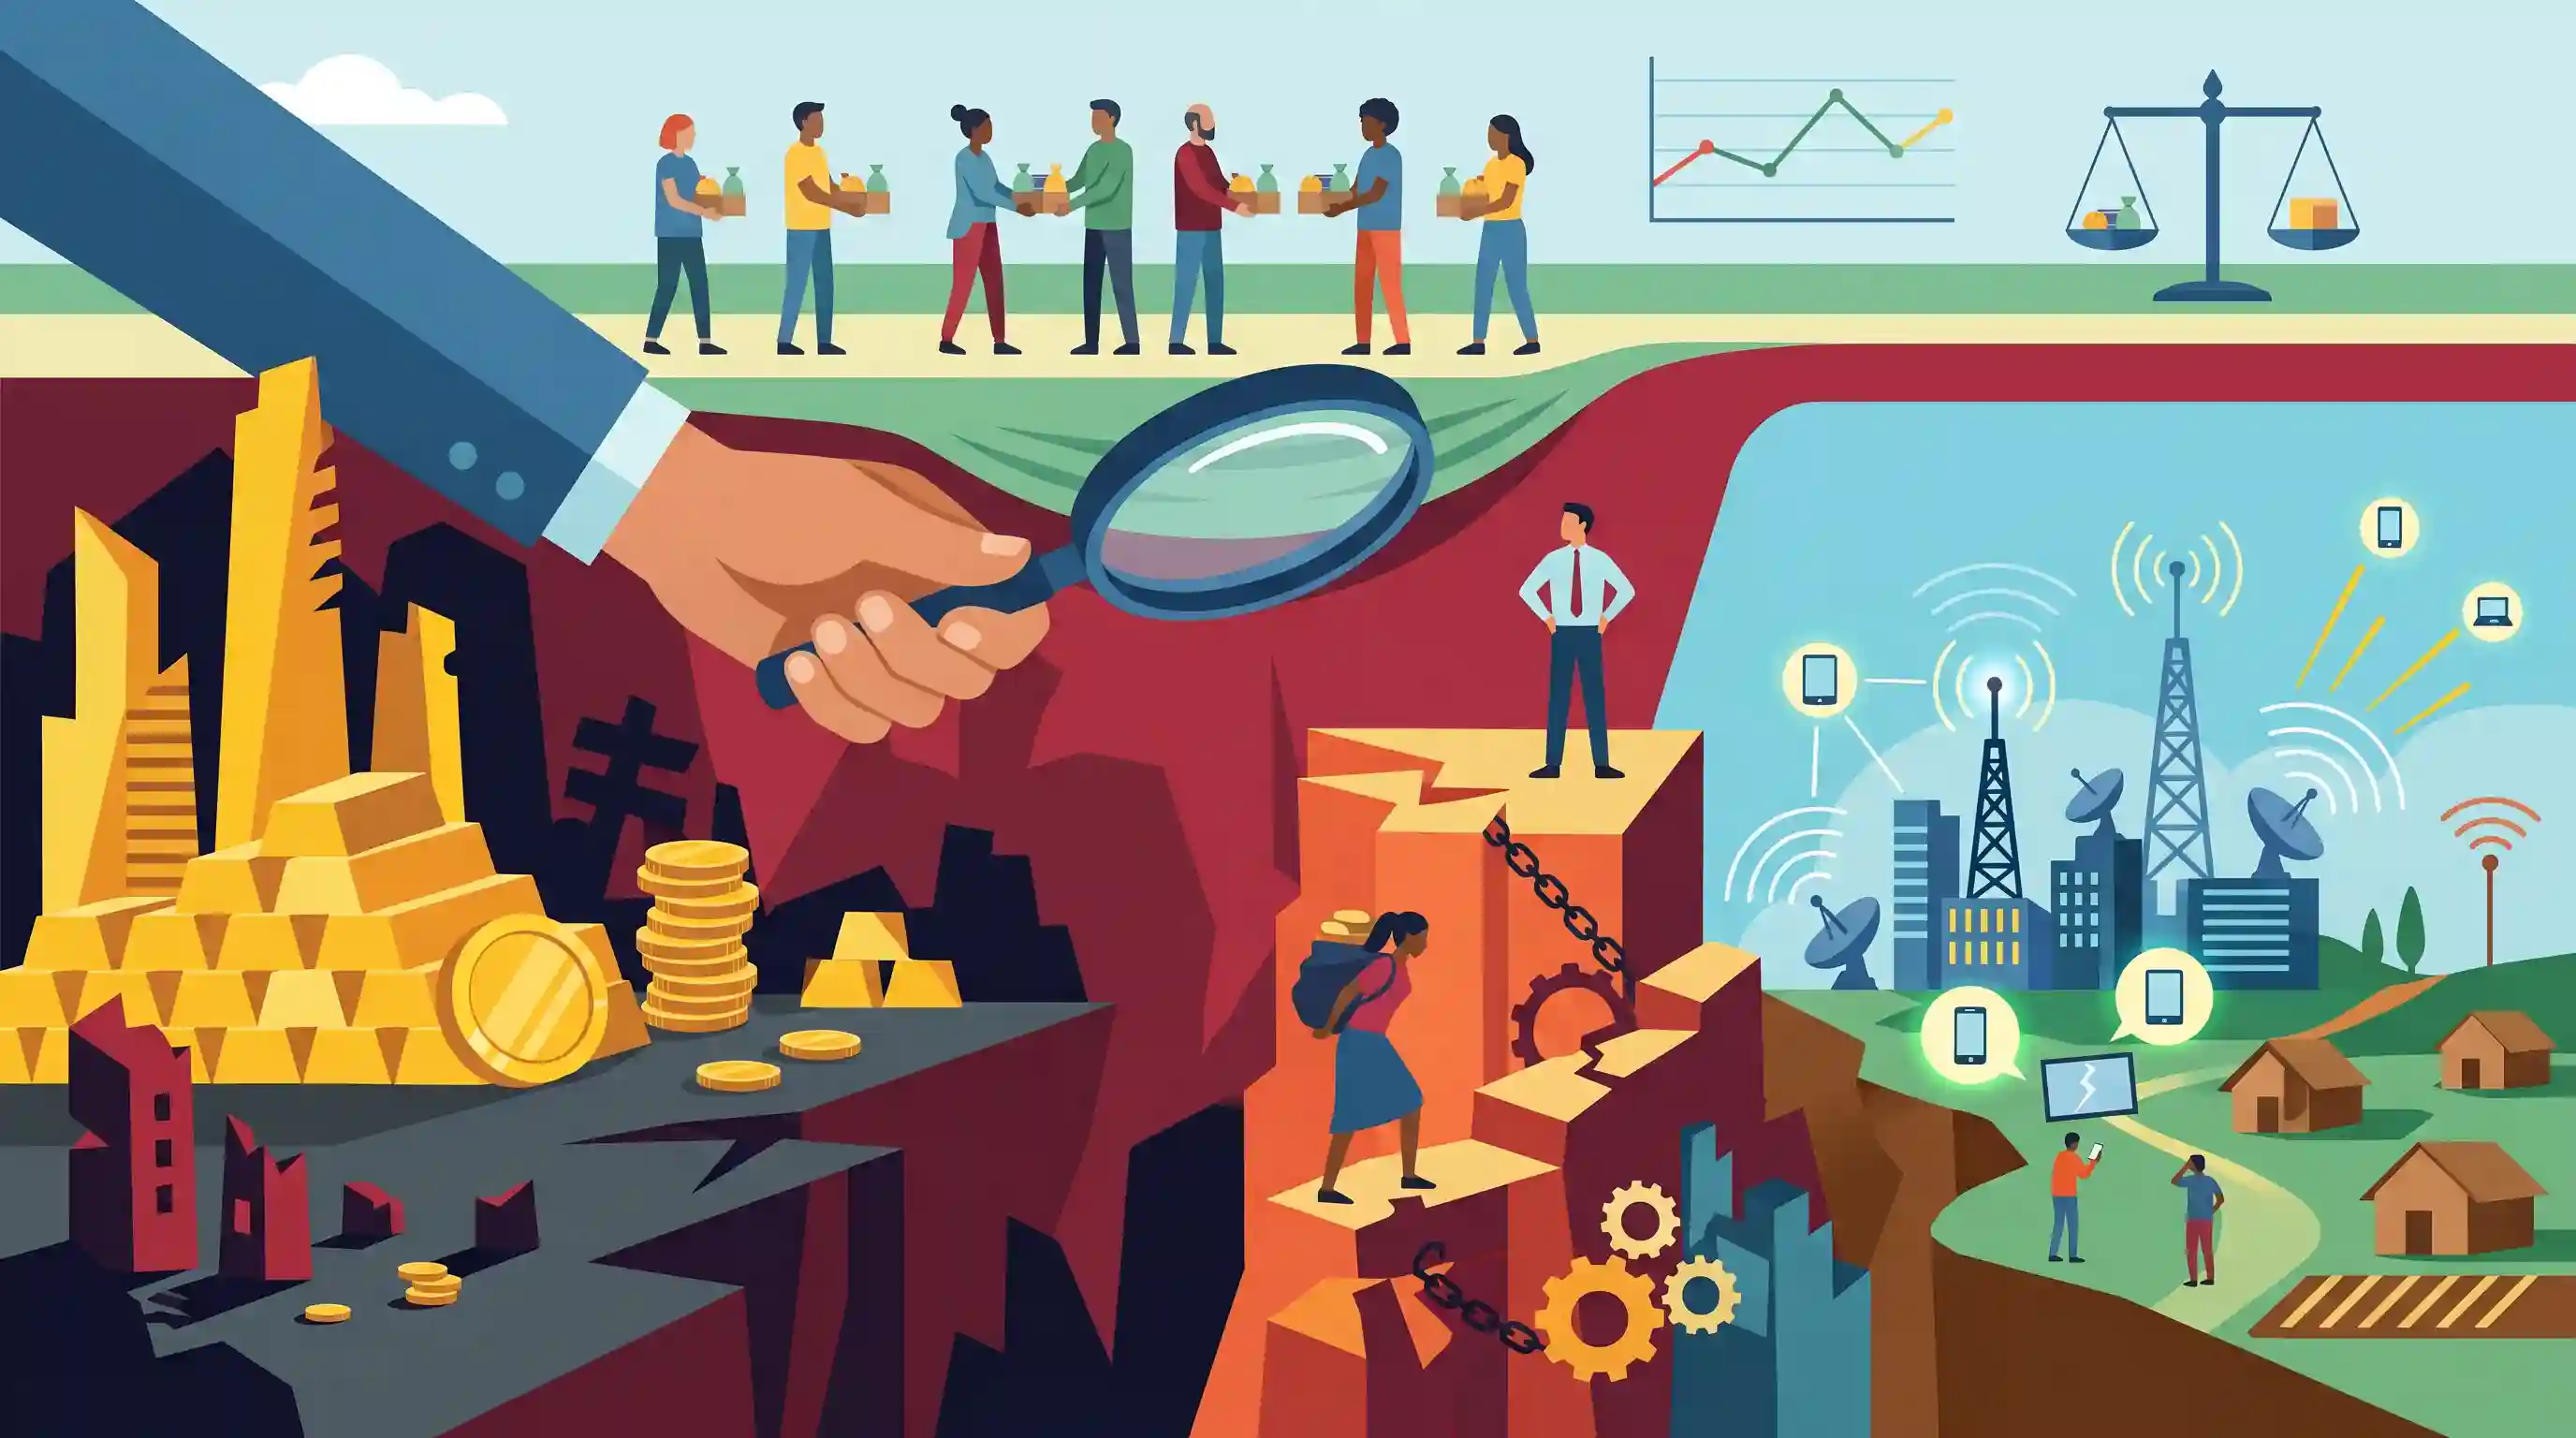
The article deconstructs the paradox of India's seemingly low Gini coefficient, explaining that the metric focuses on consumption rather than income or wealth, thereby masking deep-rooted inequalities. It argues that multidimensional disparities—including stark wealth concentration, a persistent gender gap, and a rural-urban digital divide—render purely consumption-based estimates inadequate for measuring true inclusive growth.
Key Points
- India's favorable Gini coefficient (around 25.5) creates a paradox, as it measures consumption inequality rather than actual income or wealth disparities.
- Because wealthier individuals save higher proportions of their income, consumption-based surveys artificially flatten the perceived inequality gap.
- The 'Income and Wealth Inequality in India, 1922-2023' report highlights severe economic polarization, noting the top 1% controls over 22.6% of the national income and wealth Gini approaches 75.
- Inequality extends beyond economics into multidimensional realms like a stark gender gap—evidenced by a Female Labour Force Participation Rate (FLFPR) of just 35.9% and underrepresentation in corporate leadership.
- A significant digital divide further exacerbates inequality, with rural women disproportionately lacking internet access compared to rural men and urban populations.
Important Terms
Gini Index

A statistical measure (0 to 1) of income or wealth distribution. Zero represents perfect equality; one represents perfect inequality. In India, it is often calculated using consumption data.
UPSC context
GS Paper 3: Indian Economy; tests analytical ability to critique statistical measures against multidimensional socioeconomic realities.
Consumption-based Inequality
The measurement of disparity through household spending patterns. It often understates true inequality because the wealthy save more, while the poor spend nearly all their income.
UPSC context
GS Paper 3: Poverty and Inequality; tests understanding of methodology and data limitations in measuring development.
World Inequality Lab (WIL)
A research center at the Paris School of Economics that studies global inequality. Its 2024 report highlighted extreme wealth concentration in India's top 1%.
UPSC context
GS Paper 3: Issues related to inclusive growth; relevant for comparing official data with global independent research.
Periodic Labour Force Survey (PLFS)
India's official survey by the National Statistical Office (NSO) that provides annual and quarterly estimates of employment indicators like LFPR, WPR, and Unemployment Rate.
UPSC context
GS Paper 3: Employment and Growth; essential for tracking labor market participation and the impact of economic policies.
Inclusive Growth
Economic growth that creates opportunities for all segments of society and ensures that the benefits of prosperity are distributed fairly among all sections.
UPSC context
GS Paper 3: Core syllabus topic; frequently tested in Mains regarding development, poverty alleviation, and social justice.
Digital Divide
The gap in access to and literacy of Information and Communication Technologies (ICT) between different social, economic, and geographic groups (e.g., rural vs. urban).
UPSC context
GS Paper 3: Science and Tech/Economy; tests awareness of structural barriers to equitable participation in the digital economy.
Prelims Trap
India's official Gini coefficient indicates a remarkably low level of income inequality across the country.
India's official survey data (like HCES) measures consumption expenditure, not income. Because the rich save a massive portion of their income, consumption data artificially flattens the actual inequality gap.
Static Concepts Connected
How do the Lorenz Curve and Gini Coefficient measure economic inequality?
- Lorenz Curve: A graphical representation plotting cumulative percentage of income/wealth against cumulative percentage of population. A 45-degree line represents perfect equality.
- Gini Coefficient: The ratio of the area between the line of perfect equality and the Lorenz curve to the total area under the line of equality. Ranges from 0 to 1.
- Interpretation: A value of 0 means perfect equality (everyone has the exact same), while 1 indicates perfect inequality (one person holds everything).
Why is Consumption Inequality usually lower than Income Inequality?
- Income Inequality: Measures disparities in total money earned from wages, dividends, and assets. This gap is typically vast.
- Consumption Inequality: Measures differences in actual household spending. It appears lower because high-income households save or invest a disproportionately large share of their earnings rather than consuming it.
- The Indian Context: Since official Indian surveys historically track consumption expenditure (like NSSO/HCES), the resulting Gini index underestimates the true polarization of wealth.
Cross-Topic Patterns
Consumption Gini vs. K-Shaped Recovery
India's low consumption Gini often masks a K-shaped economic reality, where formal sector wealth surges via asset markets while informal sector real wages stagnate.
FLFPR paradox and Rural Distress
While structural gender inequality keeps formal female employment low, PLFS data sometimes shows rising FLFPR driven largely by distress-induced unpaid helper roles in rural agriculture.

A 2026 multi-statement question will likely contrast India's HCES-derived consumption Gini with the World Inequality Lab's wealth Gini.
Linked PYQs · 4
Linked PYQs · 4
- 2020MainsGS3
Explain intra-generational and inter-generational issues of equity from the perspective of inclusive growth and sustainable development.
- 2019MainsGS3
It is argued that the strategy of inclusive growth is intended to meet the objectives of inclusiveness and sustainability together. Comment on this statement.
- 2025MainsGS2
Women's social capital complements in advancing empowerment and gender equity. Explain.
- 2021MainsGS2
Has digital illiteracy, particularly in rural areas, coupled with lack of Information and Communication Technology (ICT) accessibility hindered socio-economic development? Examine with justification.
