Income Disparities and Wealth Concentration in India
Source:Indian Express ↗
આ શા માટે મહત્વનું છે
This data from the World Inequality Report 2026 provides empirical backing on income disparity in India, a core theme for GS3 questions focusing on inclusive growth, inequality metrics, and redistributive policies.
સારાંશ
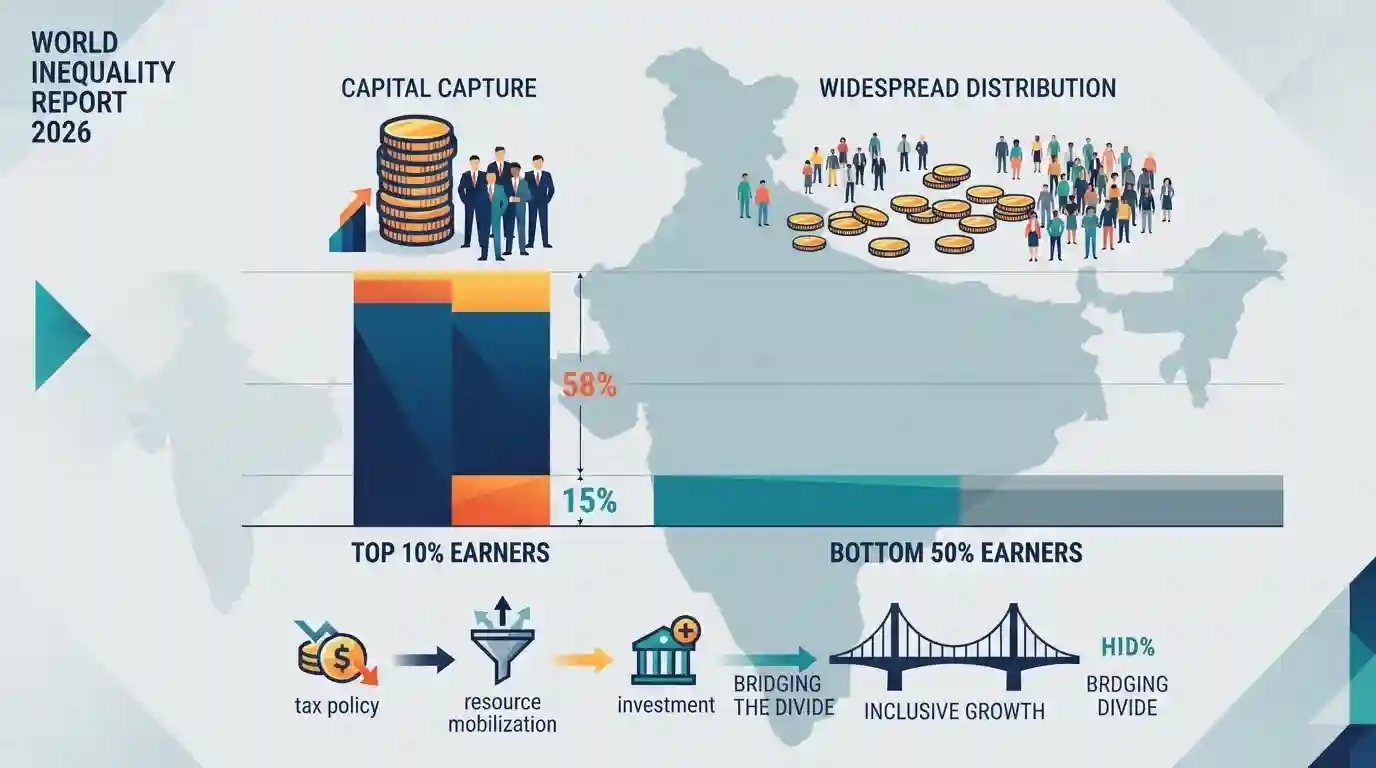
The World Inequality Report 2026 reveals that India faces severe income inequality, with the top 10% of earners capturing 58% of the national income, while the bottom 50% receives only 15%. This underscores critical concerns regarding inclusive growth, wealth redistribution, and policy measures needed to bridge the economic divide.
મુખ્ય મુદ્દા
- The World Inequality Report 2026 highlights that the top 10% of earners in India capture 58% of the national income.
- The bottom 50% of the population accounts for only 15% of the national income, pointing towards extreme wealth and income disparities.
- The report underscores the persistent challenge of economic inequality despite overall economic growth.
- Such high levels of income concentration pose threats to inclusive growth and social stability.
મહત્વપૂર્ણ શબ્દો
World Inequality Lab

A research organization based at the Paris School of Economics that maintains the World Inequality Database and produces global analytical reports on income and wealth distribution.
UPSC context
GS Paper III (Inclusive Growth & Development Issues): Data source for analyzing structural inequalities, wealth concentration, and policy efficacy in India.
World Inequality Report
A comprehensive global publication providing empirical assessments of international economic disparities, tracking income and wealth concentration across countries.
UPSC context
GS Paper III (Inclusive Growth): Evaluates resource mobilization, welfare schemes, and economic divides central to questions on poverty and development.
સંલગ્ન સ્થિર ખ્યાલો
What are the principal metrics used to measure income and wealth inequality in economic analysis?
- Gini Coefficient: Measures the extent to which the distribution of income deviates from a perfectly equal distribution, ranging from 0 to 1.
- Lorenz Curve: Compares the cumulative share of income earned by cumulative segments of the population against a 45-degree line of absolute equality.
- Decile/Quintile Ratios: Ratio of the income/wealth share held by the richest decile or percentile to that of the poorest 50% or decile.
આંતર-વિષય પેટર્ન
Inequality vs Fiscal Federalism
Rising wealth concentration tests the limits of tax-to-GDP ratios and fiscal space for public welfare schemes.
High GDP Growth vs Jobless Growth
Stark income divides challenge the 'trickle-down' assumption in high-growth developing economies, testing the mandate of inclusive growth.

Inequality metrics (top 10% vs bottom 50%) will feature in mains GS3 (Inclusive Growth) or prelims statements on World Inequality Lab.
સંલગ્ન PYQ · 2
સંલગ્ન PYQ · 2
- 2025MainsGS3
Distinguish between the Human Development Index (HDI) and the Inequality-adjusted Human Development Index (IHDI) with special reference to India. Why is the IHDI considered a better indicator of inclusive growth?
- 2022MainsGS3
Is inclusive growth possible under market economy ? State the significance of financial inclusion in achieving economic growth in India.
