Consumption Expenditure Trends and Inclusive Poverty Decline in India
Source:Indian Express ↗
Why It Matters
Poverty estimation and the inclusiveness of economic growth are perennial UPSC topics across Prelims and Mains. Understanding recent consumption data trends and their implications for poverty metrics helps candidates effectively address questions on equitable development, demographic dividends, and the impact of state welfare schemes.
Summary
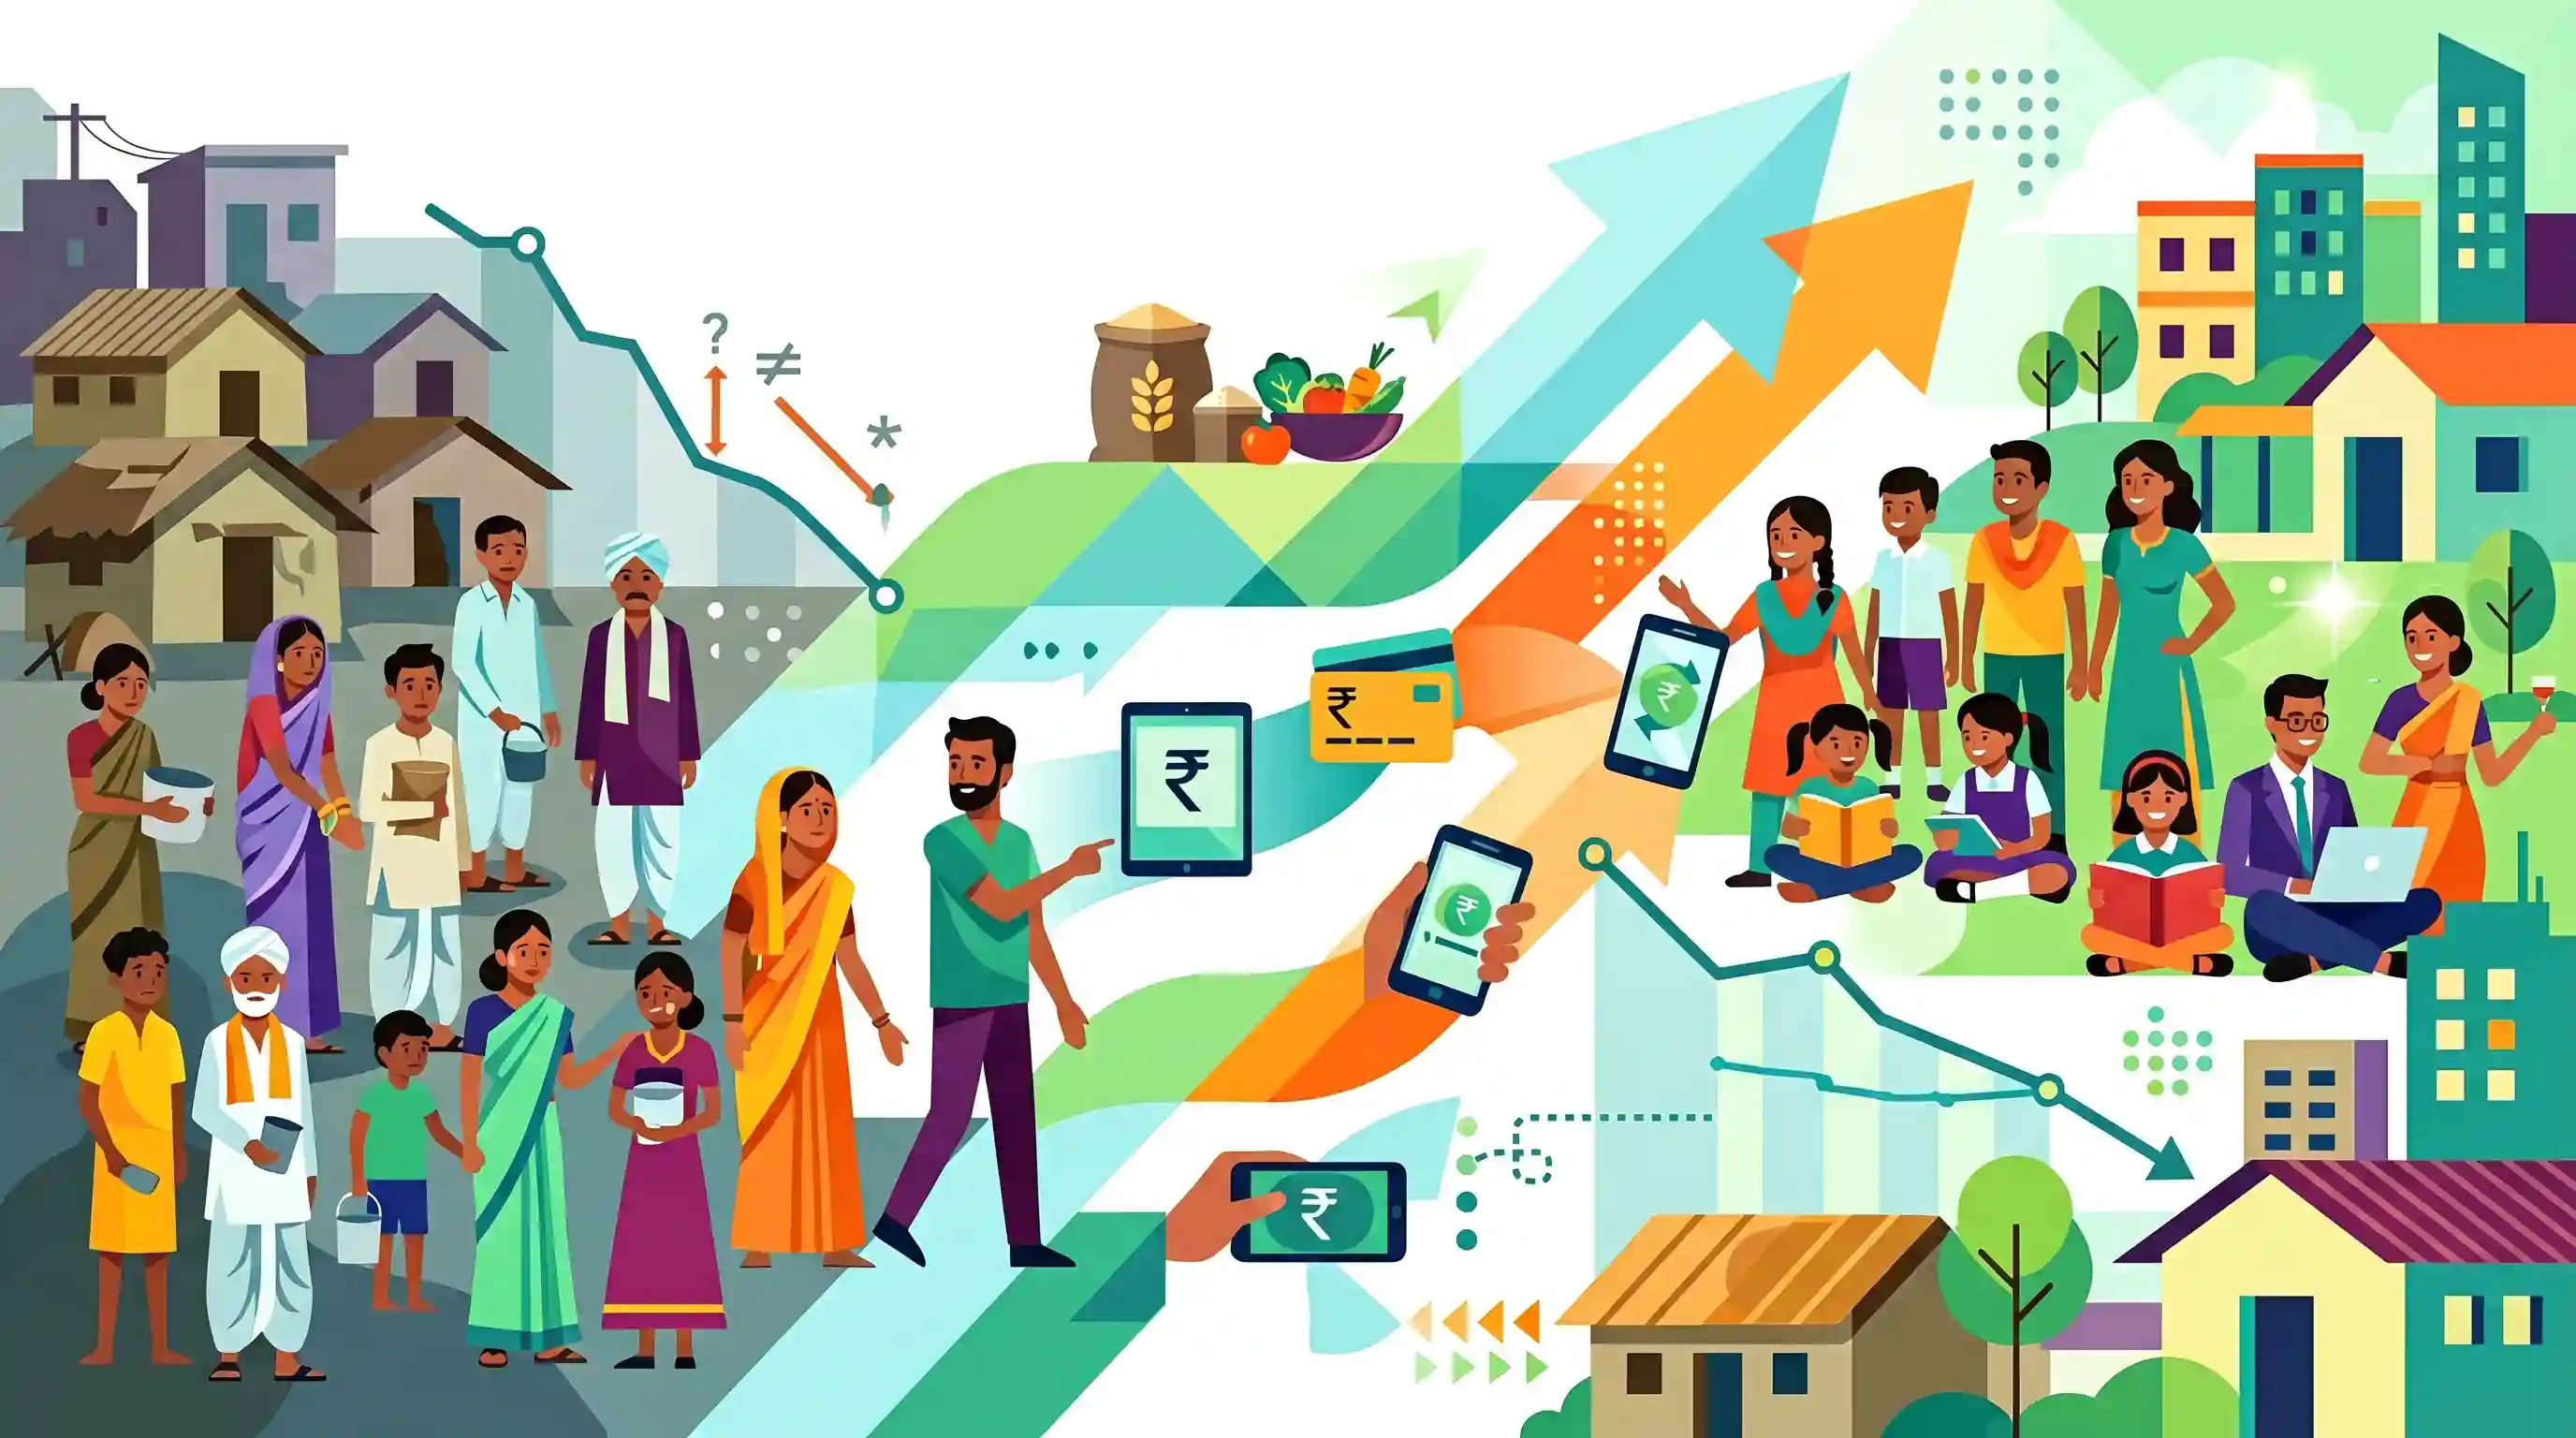
The article analyzes recent consumption expenditure data to assert that poverty in India has experienced a widespread decline, positively impacting all segments of the population. It highlights that this reduction is broad-based, bridging the rural-urban divide and cutting across various social and religious demographics. The narrowing inequality in consumption levels points toward a more inclusive trajectory of economic growth. Furthermore, the piece emphasizes the role of targeted government welfare interventions, including direct benefit transfers and food security initiatives, in significantly reducing destitution and elevating the living standards of the poorest citizens.
Key Points
- Recent consumption expenditure data indicates a broad-based and significant decline in poverty levels across India.
- Poverty reduction has been inclusive, benefiting all major socio-economic demographics, including marginalized castes and minority groups.
- The rural-urban divide in consumption and poverty has narrowed over the past decade.
- State-provided welfare measures, such as free food grains (PMGKAY) and direct benefit transfers (DBT), have been critical in supplementing household consumption and reducing extreme poverty.
Important Terms
Direct Benefit Transfer (DBT)

A mechanism transferring subsidies and benefits directly into beneficiaries' bank accounts via Aadhaar to reduce leakages, eliminate middlemen, and ensure transparency in government welfare schemes.
UPSC context
GS Paper II (Governance) and Paper III (Inclusive Growth); essential for understanding welfare delivery reforms.
Pradhan Mantri Garib Kalyan Anna Yojana (PMGKAY)
A food security scheme providing 5kg of free foodgrains monthly to 81.35 crore NFSA beneficiaries; extended for five years starting January 2024 to ensure long-term nutritional security.
UPSC context
GS Paper II (Social Justice) and Paper III (Food Security); critical for topics on hunger and destitution.
National Sample Survey Office (NSSO)
The premier statistical agency under MoSPI responsible for conducting nationwide socio-economic surveys, providing the primary consumption expenditure data used to estimate poverty levels in India.
UPSC context
GS Paper III (Indian Economy); tests knowledge of data collection agencies and poverty measurement methodologies.
NITI Aayog
India’s apex policy think-tank that replaced the Planning Commission; it monitors national progress on poverty through the Multidimensional Poverty Index (MPI) and fosters cooperative federalism.
UPSC context
GS Paper II (Executive Bodies) and Paper III (Planning); central to governance and developmental strategy questions.
Prelims Trap
"The latest HCES 2023-24 data forms the basis for calculating India's Multidimensional Poverty Index (MPI)."
HCES measures Monthly Per Capita Consumption Expenditure (MPCE), tracking monetary inequality. MPI is calculated separately by NITI Aayog using health, education, and living standard indicators.
Static Concepts Connected
How has poverty estimation methodology evolved historically in India?
- Tendulkar Committee (2009): Shifted away from calorie-only metrics to a broader, uniform consumption basket that explicitly included health and education expenditure.
- Rangarajan Committee (2014): Re-introduced modified calorie, protein, and fat norms, calculating separate consumption baskets for rural and urban areas.
- NITI Aayog MPI: Uses deprivation across 12 indicators spanning health, education, and standard of living, moving entirely away from monetary consumption.
How is consumption inequality measured economically?
- Lorenz Curve: A graphical representation showing the distribution of income or wealth across population percentiles against a line of perfect equality.
- Gini Coefficient: A numerical measure derived from the Lorenz curve, ranging from 0 (perfect equality) to 1 (maximum inequality). HCES 2023-24 shows it declining in India.
Cross-Topic Patterns
PMGKAY & WTO Subsidy Debate
The massive reduction in extreme poverty via PMGKAY showcases domestic success, but India's public stockholding for such schemes frequently triggers the 'Peace Clause' and subsidy disputes at the WTO.
DBT efficiency driven by DPI/JAM
The success of Direct Benefit Transfers in reducing inequality is heavily reliant on India's Digital Public Infrastructure (JAM trinity), connecting welfare economics to e-governance and digital inclusion.

Multi-statement question expected in 2026 mixing HCES 2023-24 consumption trends (Gini/MPCE) with NITI Aayog's MPI parameters.
Linked PYQs · 5
Linked PYQs · 5
- 2025MainsGS3
Distinguish between the Human Development Index (HDI) and the Inequality-adjusted Human Development Index (IHDI) with special reference to India. Why is the IHDI considered a better indicator of inclusive growth?
- 2017MainsGS3
What are the salient features of 'inclusive growth'? Has India been experiencing such a growth process? Analyse and suggest measures for inclusive growth.
- 2025MainsGS2
Inequality in the ownership pattern of resources is one of the major causes of poverty. Discuss in the context of 'paradox of poverty'.
- 2020MainsGS2
The incedence and intensity of poverty are more important in determining poverty based on income alone". In this context analyse the latest United Nations Multidimensional Poverty Index Report.
- 2019PrelimsGS1
In a given year in India, official poverty lines are higher in some States than in others because
