Quarterly GDP Estimates and Sectoral Growth Analysis
Source:PIB ↗
આ શા માટે મહત્વનું છે
Analyzing quarterly GDP estimates is essential for aspirants to understand India's growth trajectory, sectoral health, and macroeconomic policy formulation, mirroring standard UPSC Mains and Prelims themes on national income accounting.
સારાંશ
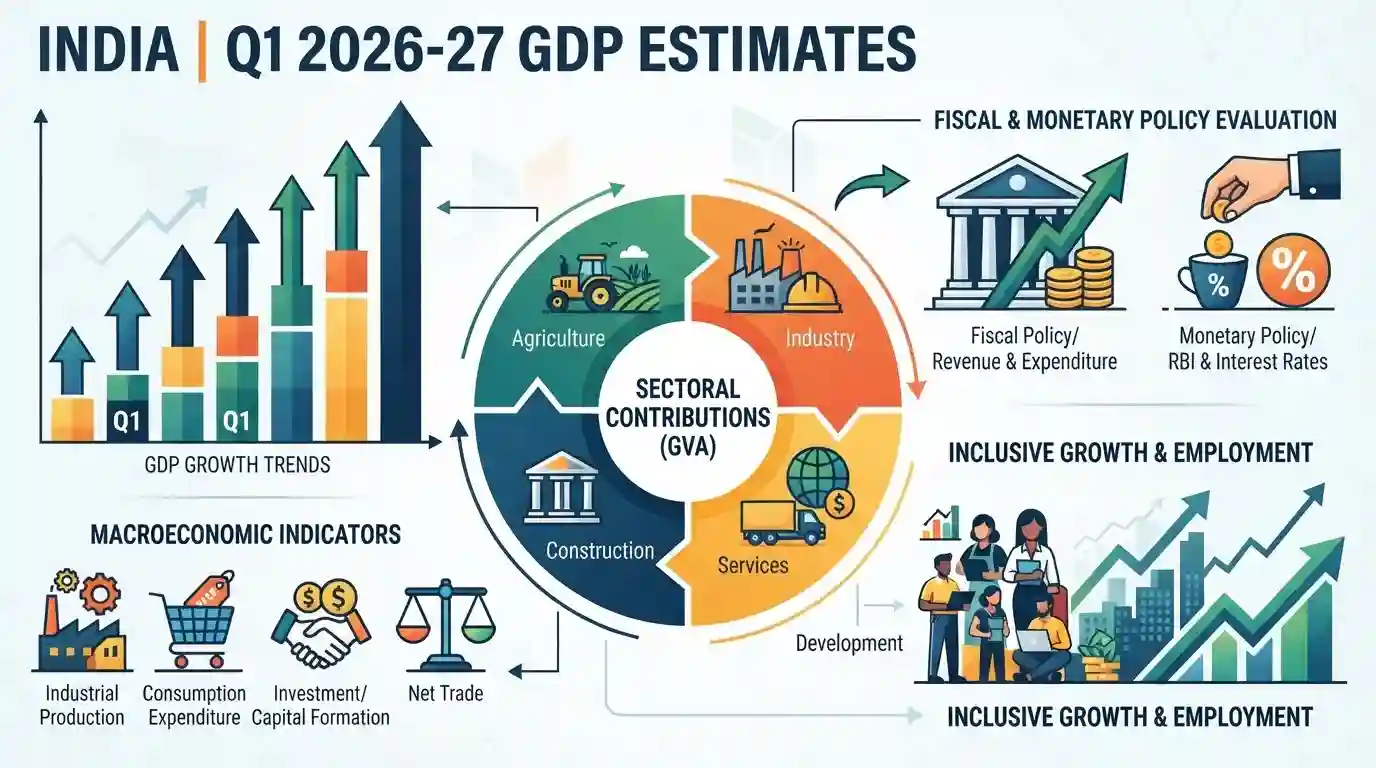
The official release concerning Q1 2026-27 GDP estimates highlights macroeconomic growth trends, sectoral contributions (GVA), and underlying economic indicators relevant for fiscal and monetary policy evaluation in India.
મુખ્ય મુદ્દા
- GDP and GVA estimates for Q1 of financial year 2026-27 provide crucial insights into macroeconomic performance and recovery.
- Sectoral performance (Agriculture, Industry, and Services) dictates structural growth patterns and policy adjustments.
- High-frequency indicators and fiscal parameters align with the quarterly data release to evaluate potential GDP and inflation trends.
મહત્વપૂર્ણ શબ્દો
Ministry of Statistics and Programme Implementation (MoSPI)

The nodal ministry responsible for the formulation of national statistical policies, methodology development, and the compilation and release of macro-economic aggregates like GDP and GVA in India.
UPSC context
UPSC GS Paper III (Indian Economy): Essential body for understanding national income accounting, data collection, and official economic growth metrics.
પ્રિલિમ્સ ટ્રેપ
Gross Value Added (GVA) at basic prices is identical to Gross Domestic Product (GDP) without any tax adjustments.
Aspirants often confuse GVA at basic prices with GDP at market prices, forgetting that net product taxes must be added to GVA to arrive at GDP.
સંલગ્ન સ્થિર ખ્યાલો
What is the difference between Gross Value Added (GVA) and Gross Domestic Product (GDP)?
- GVA Definition: Output measure capturing value of output minus intermediate consumption at basic prices without product taxes/subsidies.
- GDP Derivation: Calculated by adding net product taxes (taxes minus subsidies on products) to total GVA at basic prices.
- Policy Utility: GVA shows sector-wise supply performance, while GDP represents total economic demand and aggregate product value.
આંતર-વિષય પેટર્ન
GDP Growth + Fiscal Deficit Target Linkages
Quarterly output numbers dictate tax buoyancy figures, which directly constrain fiscal deficit targets and sovereign borrowing programs managed by RBI.
GVA Sectoral Trends + Employment Elasticity
Sectoral GVA divergence (manufacturing vs services) directly influences employment elasticity of growth, feeding into structural policy debates.

Expect a conceptual statement matching GVA vs GDP definitions alongside real vs nominal adjustments in a core economics prelims question.
સંલગ્ન PYQ · 3
સંલગ્ન PYQ · 3
- 2021MainsGS3
Explain the difference between computing methodology of India's Gross Domestic Product (GDP) before the year 2015 and after the year 2015.
- 2018PrelimsGS1
Increase in absolute and per capita real GNP do not connote a higher level of economic development, if
- 2021PrelimsGS1
Which among the following steps is most likely to be taken at the time of an economic recession?
