Poverty Estimation Methodology and Consumption Inequality Debate
Source:The Hindu ↗
Why It Matters
Accurate poverty and inequality assessments are critical for identifying beneficiaries for welfare programs and analyzing the effectiveness of India's economic policies. The ongoing debate emphasizes the importance of robust data methodologies like the Household Consumption Expenditure Survey in governance.
Summary
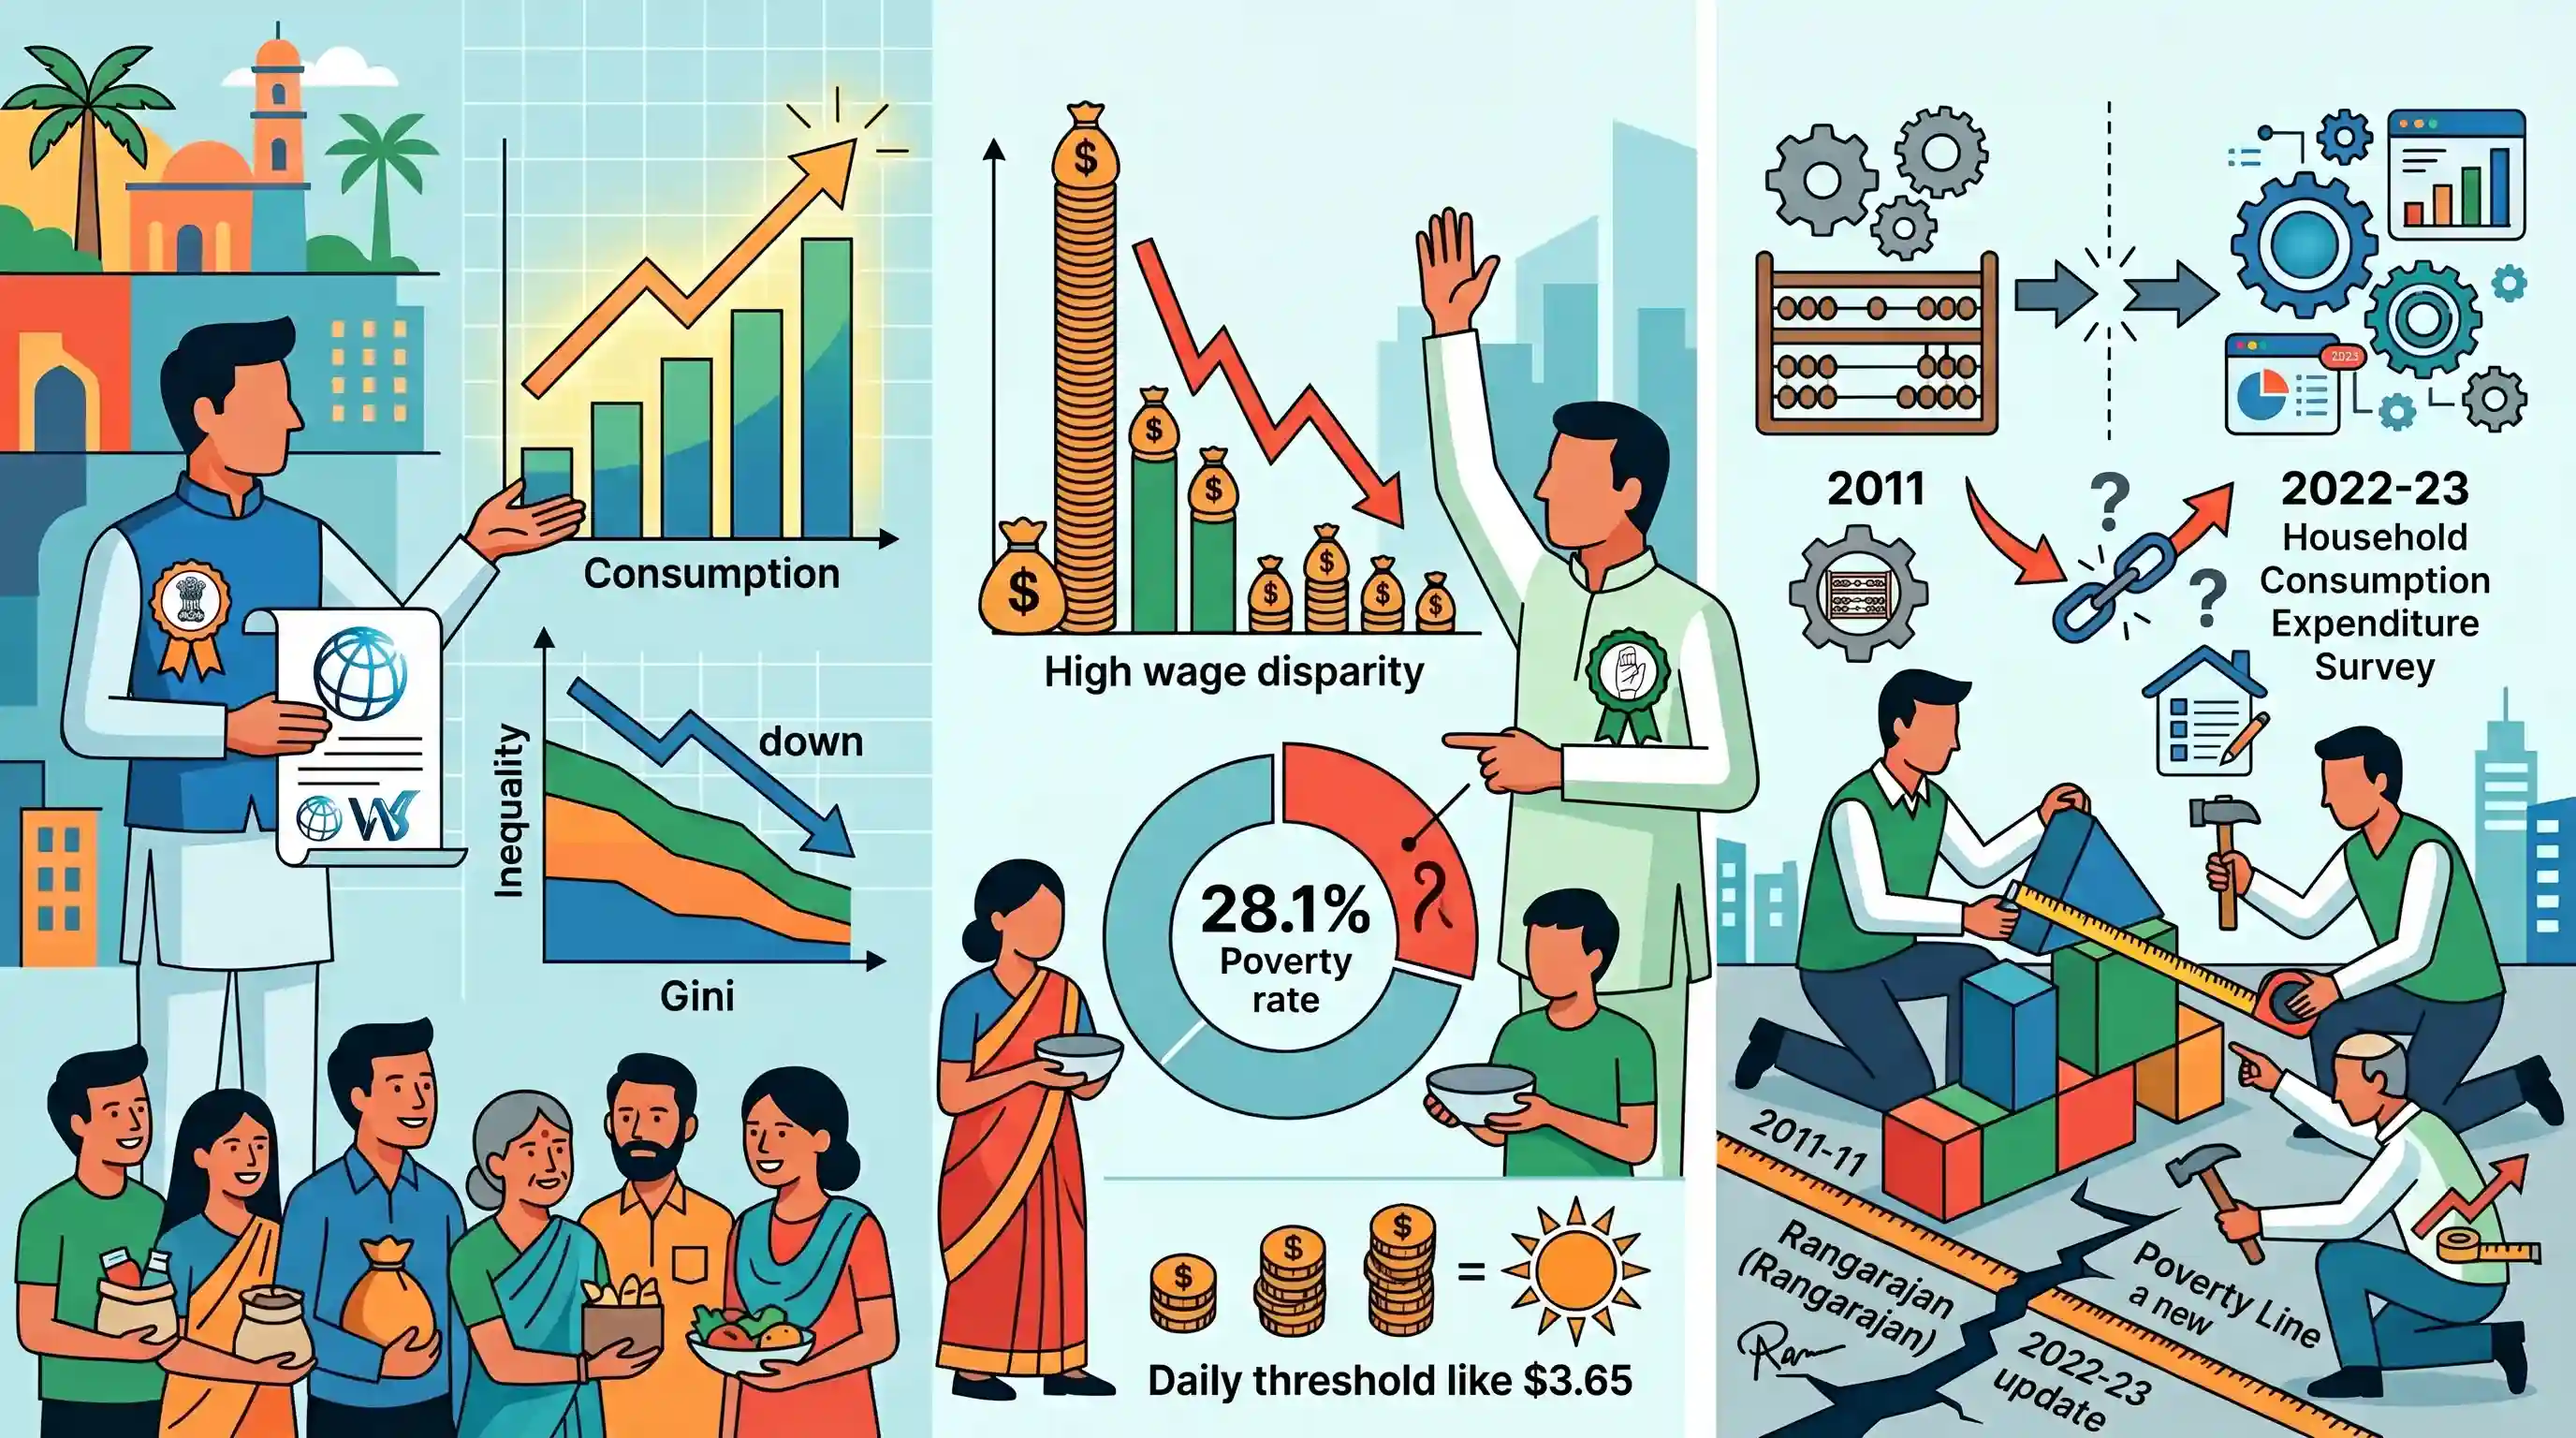
The Indian National Congress has criticized the Central government's use of a recent World Bank report to claim that India has become one of the most equal societies globally. While the report notes a decline in consumption-based inequality (Gini coefficient), the opposition highlights that it also exposes a high wage disparity and an alarming 28.1% poverty rate based on the $3.65/day threshold. Citing methodological shifts in the 2022-23 Household Consumption Expenditure Survey that make historical comparisons difficult, Congress urged the government to update its official poverty line, which has remained untouched since the 2014 Rangarajan Committee.
Key Points
- The Central government claimed India is the 'fourth most equal country' based on a World Bank report showing a drop in the consumption-based Gini coefficient to 25.5 in 2022-23.
- The Congress party challenged this narrative, pointing out that the same report highlights severe wage disparities, with the top 10% earning 13 times more than the bottom 10%.
- Using the $3.65/day poverty line appropriate for lower-middle-income nations, the World Bank estimated India's poverty rate to be 28.1% in 2022.
- Methodological changes in the 2022-23 Household Consumption Expenditure Survey present challenges in comparing historical consumption data.
- Critics urged the government to officially update India's poverty estimation methodology, which has not been revised since the Rangarajan Committee's report in 2014.
Important Terms
Gini Coefficient

A statistical measure of distribution representing income or consumption inequality. It ranges from 0 (perfect equality) to 1 (or 100, absolute inequality). India's consumption Gini reportedly fell to 25.5 in 2022-23.
UPSC context
GS Paper III (Economy). Critical for discussing growth vs. distribution and measuring the success of inclusive development policies.
Household Consumption Expenditure Survey (HCES)
A quinquennial survey by the National Statistical Office (NSO) that collects data on household spending. It is the primary data source for estimating poverty and updating the Consumer Price Index.
UPSC context
GS Paper III (Economics/Social Justice). Relevant for data-driven analysis of poverty and the debate over survey methodology changes.
Rangarajan Committee
The 2014 expert group that revised India's poverty estimation methodology. It proposed a higher poverty line than the Tendulkar Committee, defining poverty through a consumption basket including food, education, and health.
UPSC context
GS Paper III (Poverty & Growth). A landmark committee often compared with the Tendulkar Committee in mains questions on poverty estimation.
Inclusive Growth
Economic growth that creates opportunities for all segments of society and distributes the dividends of increased prosperity fairly, both in monetary and non-monetary terms.
UPSC context
GS Paper III (Syllabus topic). Tests understanding of whether high GDP growth effectively reaches the bottom quintiles of the population.
Modified Mixed Reference Period (MMRP)
A survey methodology that uses different recall periods for different goods (e.g., 7 days for perishables, 365 days for durables). It generally captures higher expenditure than the Uniform Reference Period.
UPSC context
GS Paper III (Economics). Technical understanding of how survey data changes impact official poverty figures and international comparisons.
$3.65/day Poverty Line
The World Bank's poverty threshold for lower-middle-income countries (using 2017 PPP). Critics use this higher bar to argue that India's poverty rate remains significant at 28.1%.
UPSC context
GS Paper II/III (International Relations/Economy). Tests awareness of international standards vs. national poverty lines in global development discourse.
Prelims Trap
India calculates its official Gini coefficient and poverty estimates using national household income and wage data.
India traditionally uses Monthly Per Capita Consumption Expenditure (MPCE) from NSSO surveys, not income data, to calculate both poverty lines and the Gini coefficient.
Static Concepts Connected
How does the Gini Coefficient measure inequality in an economy?
- Core Definition: It is a statistical measure of economic inequality ranging from 0 (perfect equality) to 1 (perfect inequality).
- Lorenz Curve linkage: It is mathematically derived from the Lorenz curve, representing the ratio of the area between the line of absolute equality and the actual distribution curve.
- Indian Context: In India, the Gini index is typically calculated based on consumption expenditure rather than income, which can mask structural wealth and wage gaps.
What were the key recommendations of the Rangarajan Committee (2014) on poverty?
- Nutrition Norms: Reverted to separate rural and urban consumption baskets, explicitly factoring in requirements for calories, proteins, and fats.
- Non-food Expenses: Included normative private expenditure on essential non-food items like education, clothing, conveyance, and house rent.
- Current Status: It remains the last major poverty estimation panel in India, highlighting the decade-long gap in updating official poverty methodologies.
Cross-Topic Patterns
HCES changes & CPI base revision
The 2022-23 HCES methodological shifts, which now account for free welfare items, complicate historical comparisons but are vital for the impending revision of the outdated Consumer Price Index (CPI) base year.
Monetary vs Multidimensional Poverty (MPI)
While this debate focuses on monetary thresholds ($3.65 PPP), UPSC focuses heavily on NITI Aayog’s National MPI, which tracks non-income deprivations in health, education, and standard of living.

Expect a 2026 question contrasting consumption-based Gini vs income Gini, tied to the HCES 2022-23 methodological shifts and MPI metrics.
Linked PYQs · 3
Linked PYQs · 3
- 2019PrelimsGS1
In a given year in India, official poverty lines are higher in some States than in others because
- 2025MainsGS2
Inequality in the ownership pattern of resources is one of the major causes of poverty. Discuss in the context of 'paradox of poverty'.
- 2020MainsGS2
The incedence and intensity of poverty are more important in determining poverty based on income alone". In this context analyse the latest United Nations Multidimensional Poverty Index Report.
