Madhya Pradesh Economic Survey GSDP Growth Rate and Per Capita Income
Source:goodreturns ↗
Why It Matters
Crucial for MPPSC aspirants tracking the latest state economic parameters, budgetary metrics, and sectoral growth indicators.
Summary
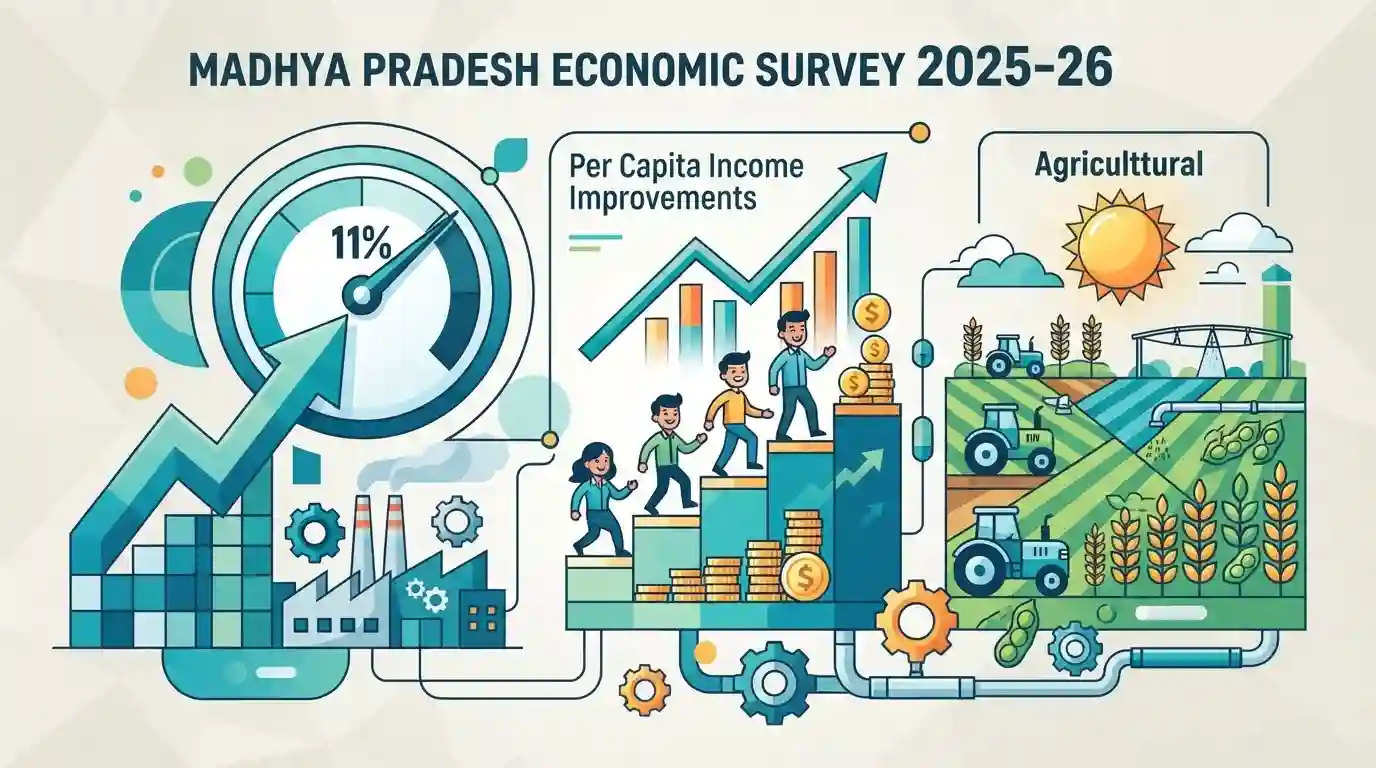
The Madhya Pradesh Economic Survey 2025-26 highlights robust economic performance with a projected GSDP growth rate of 11% and significant improvements in per capita income, driven largely by advancements in the industrial and agricultural sectors.
Key Points
- Madhya Pradesh Economic Survey 2025-26 projects a strong GSDP growth rate of 11 percent.
- Significant boost observed in per capita income reflecting economic expansion across the state.
- Industrial sector growth plays a critical role in driving the state's recent economic development trajectory.
Important Terms
Gross State Domestic Product (GSDP)

The total monetary value of all finished goods and services produced within Madhya Pradesh over a specific period, serving as a primary indicator of the state's economic health and growth rate.
UPSC context
Relevant for MPPSC Paper III (Economy of Madhya Pradesh — growth trends, sector contributions, and macroeconomic indicators).
Per Capita Income
The average income earned by each individual in Madhya Pradesh in a given year, calculated by dividing total state income by population, used as a key benchmark of living standards.
UPSC context
Important for MPPSC Paper III (Poverty, welfare indices, and socio-economic development trends in Madhya Pradesh).
Madhya Pradesh Economic Survey
The official annual document detailing Madhya Pradesh's economic performance, sector-wise growth contributions (primary, secondary, and tertiary), and key fiscal parameters tabled before the state assembly.
UPSC context
Essential for MPPSC Paper III (State economic planning, budgetary trends, and fiscal policy analysis).
Prelims Trap
projected GSDP growth rate of 11 percent (without distinguishing nominal vs constant prices)
Aspirants often confuse GSDP growth at constant prices with nominal growth. The 11.14% figure is nominal, while real (constant 2011-12 prices) growth is 8.04%.
Static Concepts Connected
What is the sectoral composition and GSDP growth pattern of Madhya Pradesh as per recent economic surveys?
- Sectoral Shares: Primary sector holds the highest share (around 43%), followed by the tertiary services sector (~37%) and secondary industrial sector (~20%).
- GSDP Magnitude: MP's nominal GSDP crosses ₹16.69 lakh crore, driven by robust double-digit nominal growth (approx 11%) and strong agricultural output.
- Per Capita Income: Per capita income at current prices reaches ₹1,69,050, showing substantial multi-fold progress from the 2011-12 base year.
Cross-Topic Patterns
Agrarian Dominance vs. Industrial Diversification in MP
MP's primary sector contributes 43.09% to GSDP, making agrarian distress or bumper crop cycles a direct determinant of overall fiscal health and tax collection.

MPPSC Paper 3/1: Expect objective questions on specific GSDP sectoral shares (Primary 43%, Tertiary 37%, Secondary 20%) and per capita income.
Linked PYQs · 2
Linked PYQs · 2
- 2024MPPSC_PRELIMSGS1
In the year 2022-23, on comparing the per capita income of Madhya Pradesh and that of India on the basis of advanced estimates at constant (2011-12) prices, we find that
- 2025MPPSC_PRELIMSGS1
How much has the per capita income of Madhya Pradesh, at current Prices, increased from financial year 2011-12 to financial year 2023-24?
