June Quarter GDP Expansion Driven by Agriculture and Services
Source:Indian Express ↗
Why It Matters
Consistent GDP growth driven by key sectors like agriculture and services is a crucial indicator of economic resilience and development. Understanding sectoral contributions and GDP calculation methodologies is foundational for GS3 (Indian Economy), particularly in analyzing government policies aimed at inclusive growth and employment generation.
Summary
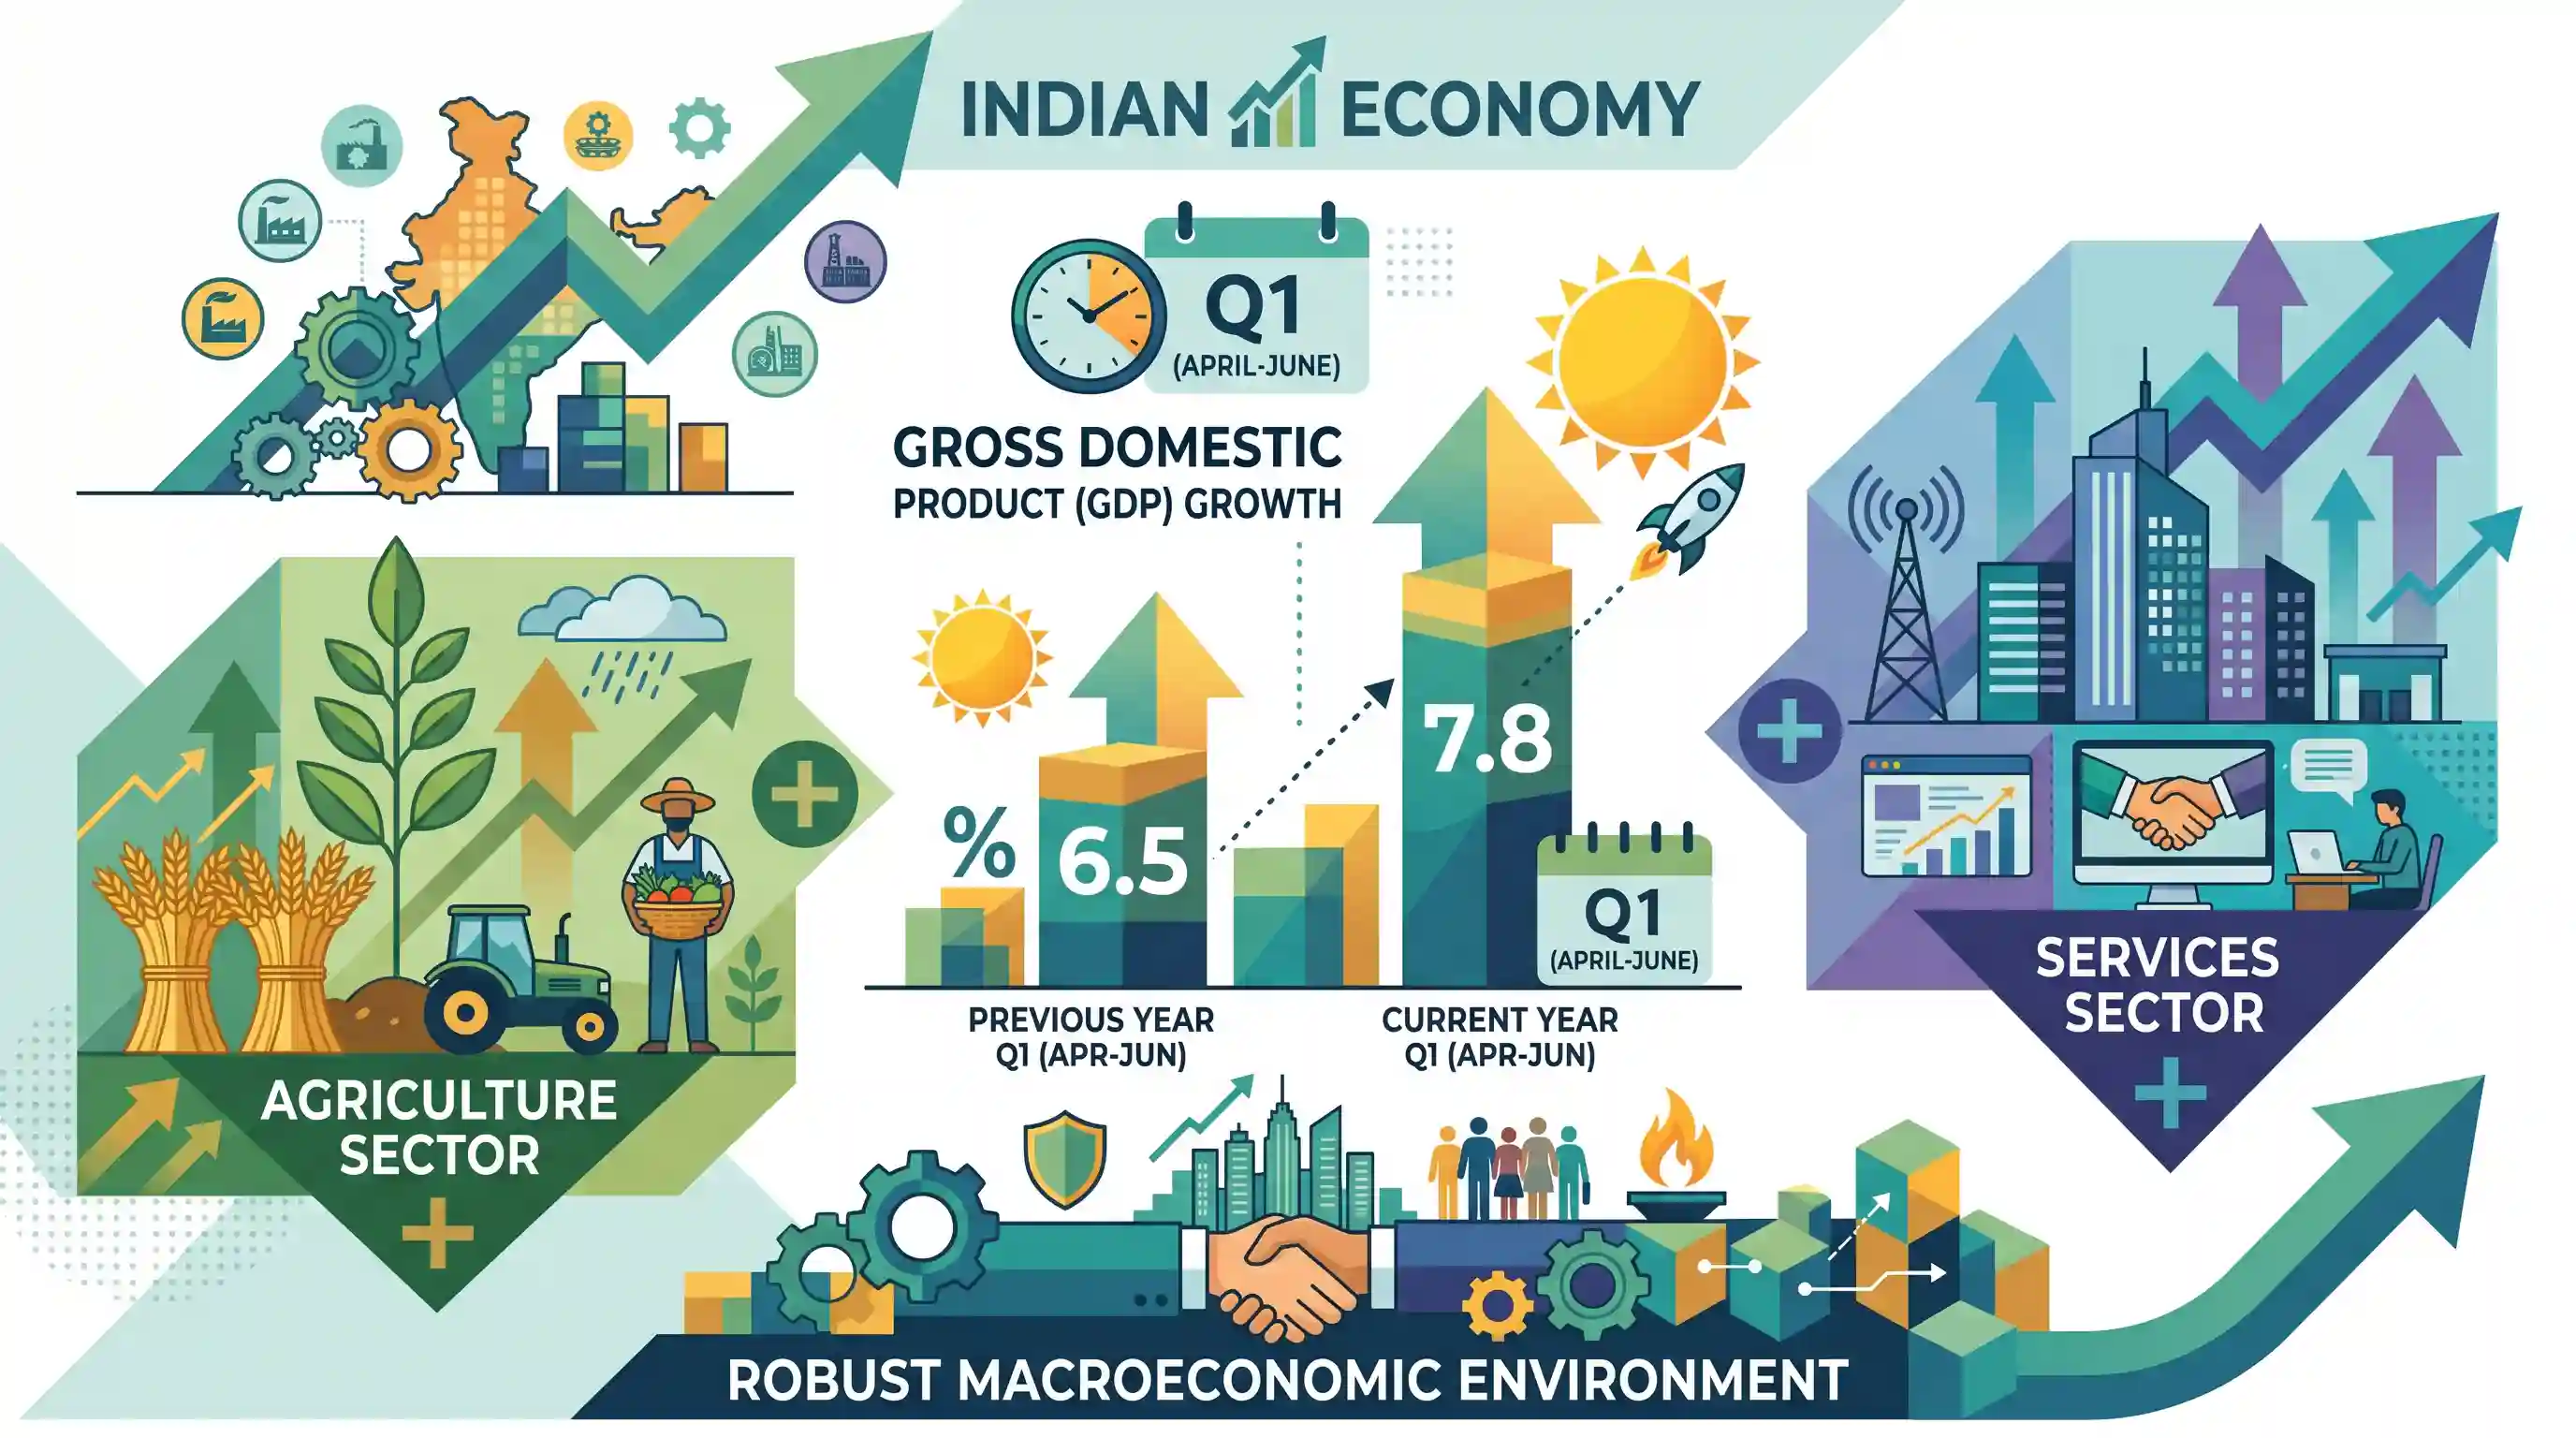
India's Gross Domestic Product (GDP) registered a robust growth of 7.8% in the first quarter (April-June) of the financial year, accelerating from the 6.5% recorded during the same period last year. This economic expansion was primarily driven by strong performances in the agriculture and services sectors, highlighting a resilient domestic macroeconomic environment.
Key Points
- India's GDP grew at 7.8% in the April-June quarter (Q1) of the current financial year.
- This growth marks an acceleration from the 6.5% recorded in the corresponding quarter of the previous year.
- The economic expansion was primarily driven by robust performances in the agriculture and services sectors.
Important Terms
Gross Domestic Product (GDP)

Total market value of all final goods and services produced within a country's borders during a specific period. It is a demand-side indicator of economic activity.
UPSC context
GS Paper 3: Indian Economy. Key measure of national income and economic health; frequently asked in Prelims and Mains.
Gross Value Added (GVA)
Measure of the value added by different sectors (Agriculture, Industry, Services) after deducting intermediate costs. It provides a supply-side picture of economic activity.
UPSC context
GS Paper 3: Economic Growth. Essential for understanding sectoral contributions and the discrepancy between production and market prices.
National Statistical Office (NSO)
An office under the Ministry of Statistics and Programme Implementation (MoSPI) responsible for the collection, compilation, and release of national income data and GDP estimates.
UPSC context
GS Paper 3: Economic Planning. Important for Prelims regarding institutional frameworks for data collection in India.
Services Sector
The largest component of the Indian economy, contributing over 50% to GVA. It includes trade, hotels, transport, communication, banking, insurance, and real estate.
UPSC context
GS Paper 3: Indian Economy and growth. Tests knowledge of the structural shift in India's economy from primary to tertiary sector.
Reserve Bank of India (RBI)
India's central bank that formulates monetary policy to maintain price stability while supporting growth. It monitors macroeconomic indicators to manage liquidity and inflation.
UPSC context
GS Paper 3: Monetary Policy. Central to topics on banking, inflation control, and financial stability.
Agriculture Sector
The primary sector encompassing farming and allied activities. It remains critical for employment (~46% of workforce) and food security, despite a smaller GDP share.
UPSC context
GS Paper 3: Major crops and cropping patterns. Vital for questions on rural development and inclusive growth.
Prelims Trap
India uses 'GDP at factor cost' as the primary headline measure for official economic growth estimates.
Following the 2015 methodology overhaul, India shifted its primary headline measure of economic output to 'GDP at market prices', aligning with global practices.
Static Concepts Connected
How does GDP at Market Prices differ from GDP at Factor Cost?
- Factor Cost: Represents the actual income earned by factors of production (rent, wages, interest, profit) and includes government subsidies, but excludes indirect taxes.
- Market Prices: Reflects what consumers actually pay in the economy. It includes indirect taxes (like GST) and excludes government product subsidies.
- The Formula: GDP at Market Prices = GDP at Factor Cost + Indirect Taxes - Subsidies.
Which agency is responsible for compiling India's official national income data?
- Nodal Agency: The National Statistical Office (NSO) under the Ministry of Statistics and Programme Implementation (MoSPI) compiles and releases official quarterly and annual GDP estimates.
- 2019 Merger: The NSO was established in 2019 by merging the Central Statistics Office (CSO) and the National Sample Survey Office (NSSO).
- Base Year: The current base year used for calculating India's national accounts (Real GDP) is 2011-12, revised from the earlier 2004-05 base.
Cross-Topic Patterns
Jobless growth & structural shift
Strong growth in services and agriculture highlights India's missing manufacturing middle, frequently linking quarterly GDP data to GS3 debates on jobless growth and the demographic dividend.
Growth vs. Economic Development
High quantitative GDP growth frequently prompts Mains questions contrasting headline numbers with qualitative development indicators like the HDI, multidimensional poverty, and rising inequality.

Expect Prelims 2026 to test the exact difference between GDP at Market Prices and GVA at Basic Prices regarding product vs production taxes.
Linked PYQs · 4
Linked PYQs · 4
- 2021MainsGS3
Explain the difference between computing methodology of India's Gross Domestic Product (GDP) before the year 2015 and after the year 2015.
- 2023MainsGS3
Faster economic growth requires increased share of the manufacturing sector in GDP, particularly of MSMEs. Comment on the present policies of the Government in this regard.
- 2022PrelimsGS1
Which of the following activities constitute real sector in the economy? 1. Farmers harvesting their crops 2. Textile mills converting raw cotton into fabrics 3. A commercial bank lending money to a trading company 4. A corporate body issuing Rupee Denominated Bonds overseas Select the correct answer using the code given below:
- 2018PrelimsGS1
Increase in absolute and per capita real GNP do not connote a higher level of economic development, if
