India Industrial Production Growth Slips to Nine-Month Low
Source:The Hindu ↗
Why It Matters
The IIP is a critical macroeconomic indicator used to track the health of the industrial sector. UPSC frequently tests the components, weights, and publishing agency (MoSPI) of the IIP and the Index of Eight Core Industries in Prelims. For Mains (GS3), understanding industrial slowdowns is crucial for analyzing economic growth, employment generation, and the impact of the manufacturing sector on GDP.
Summary
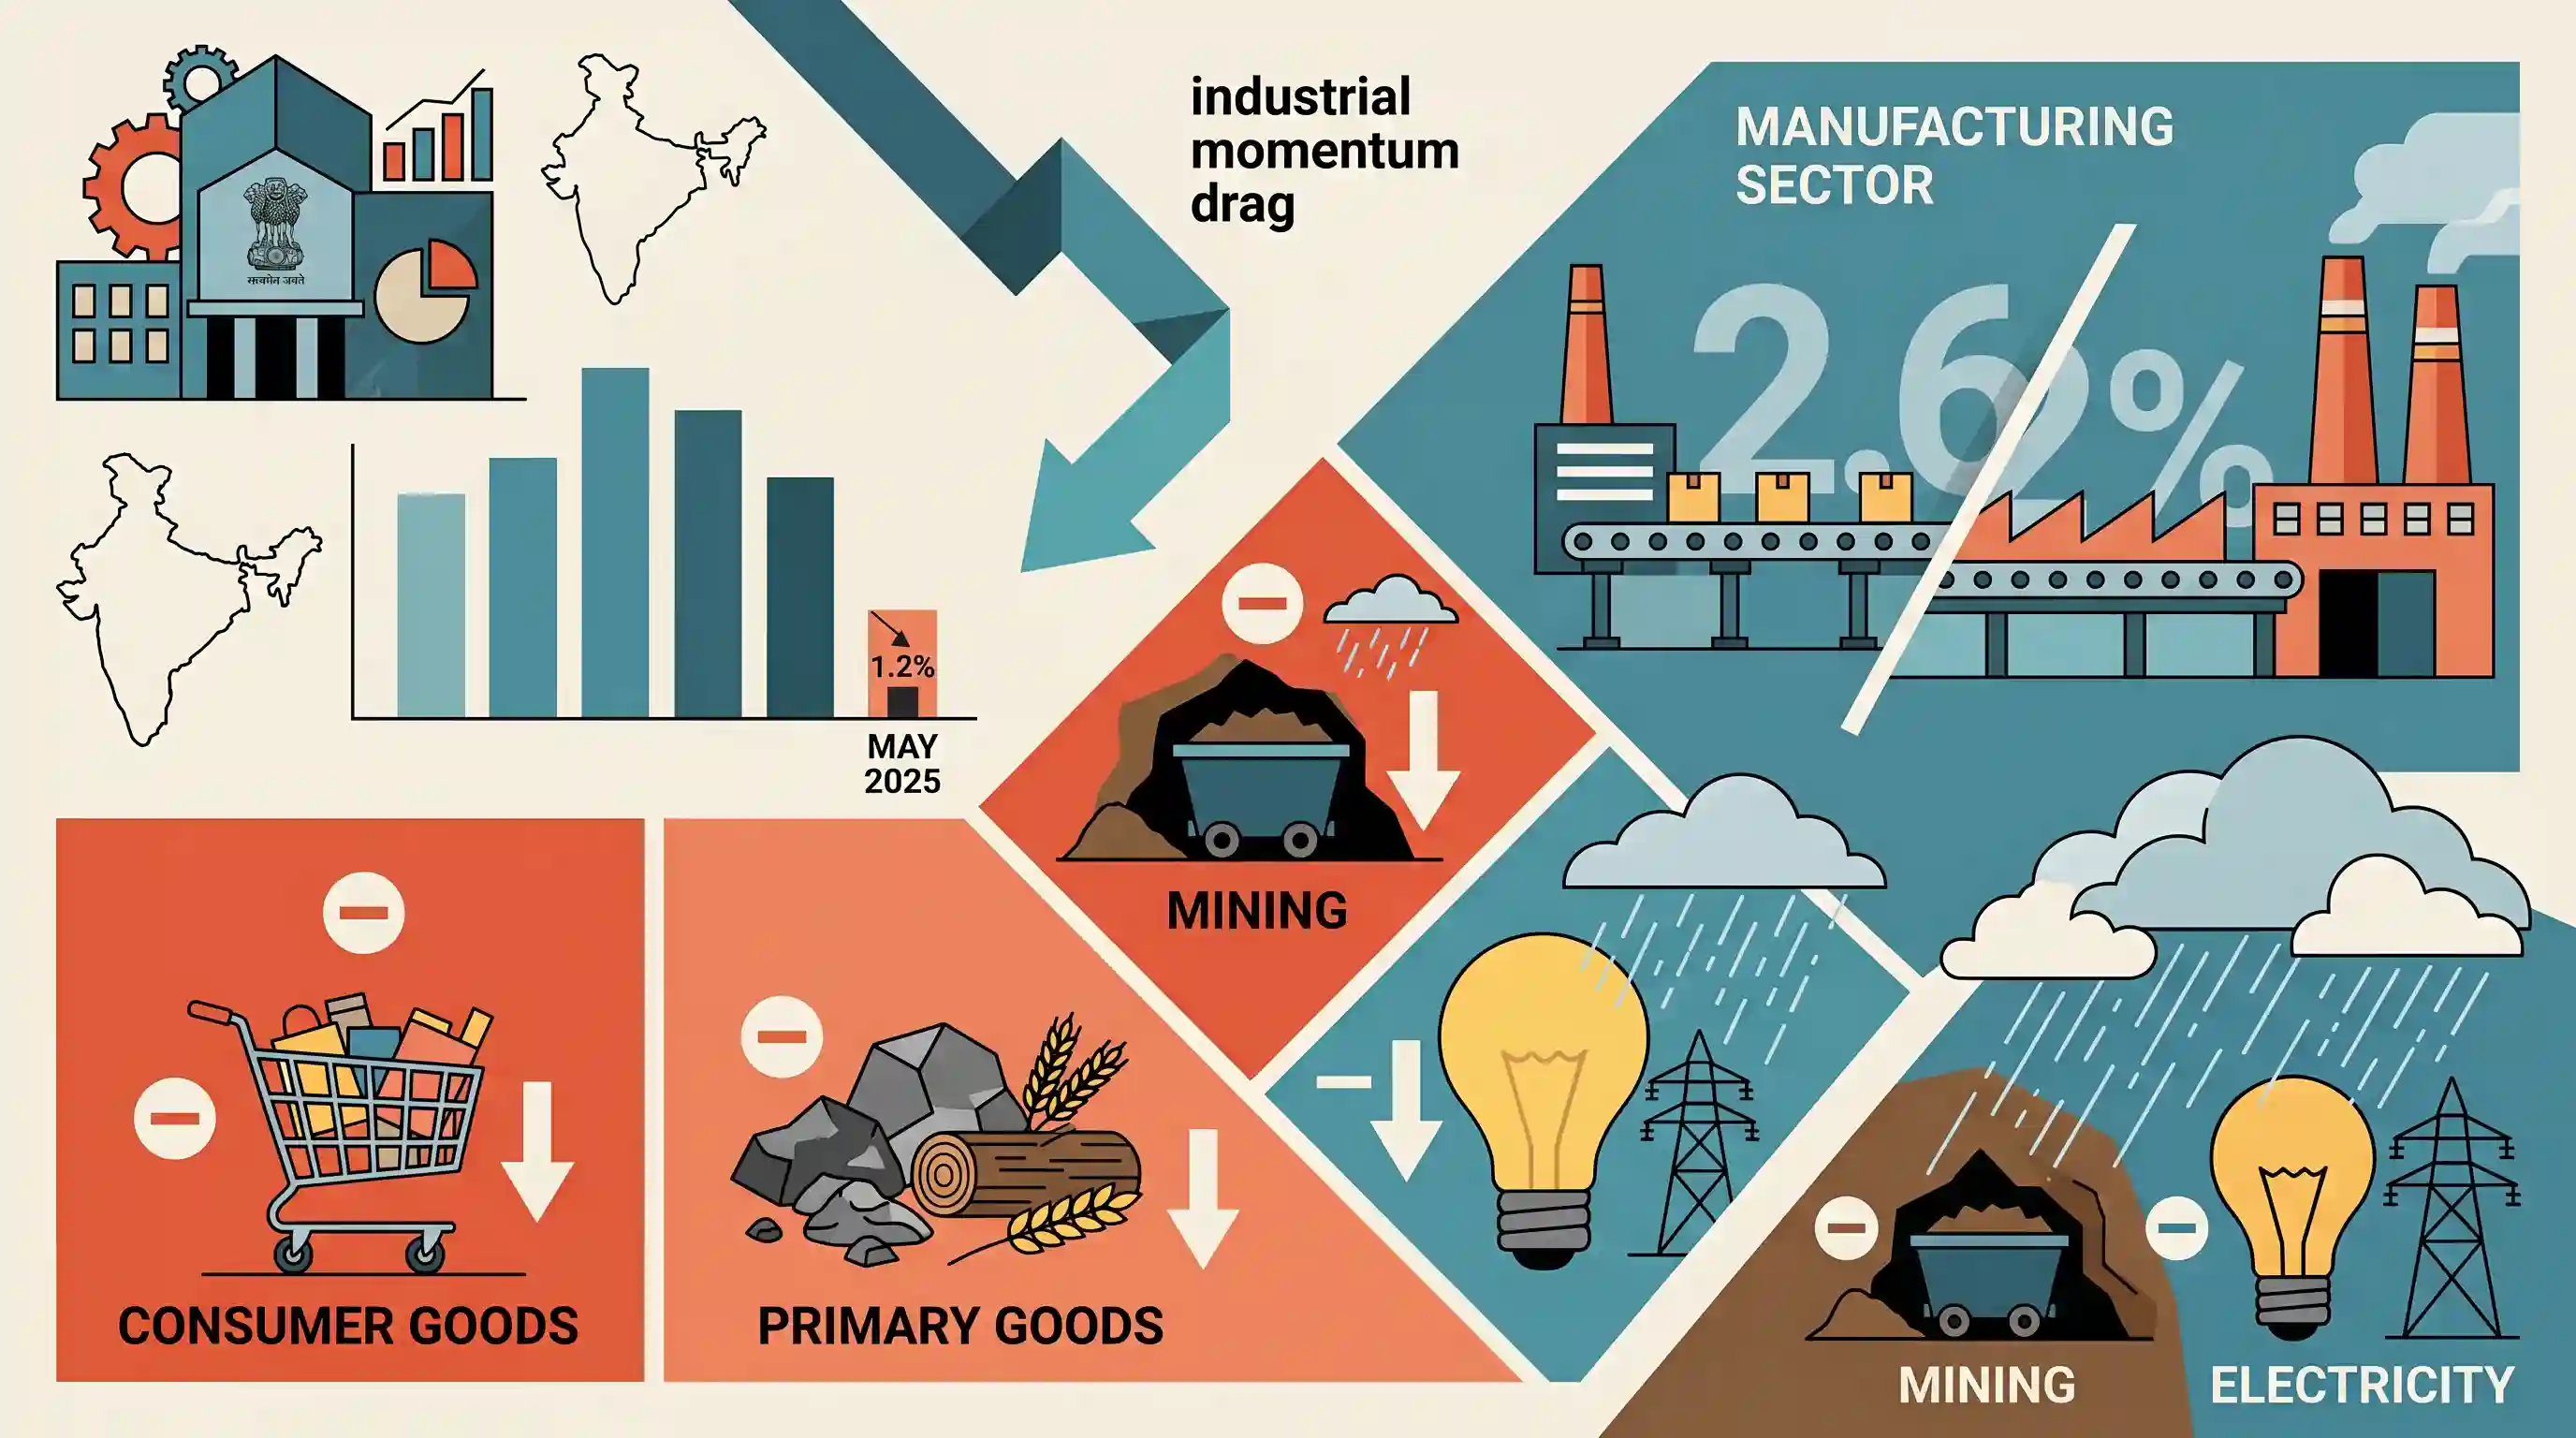
India's industrial growth, as measured by the Index of Industrial Production (IIP), slowed to a nine-month low of 1.2% in May 2025, down from higher levels in previous months. The deceleration was driven by a broad-based slowdown across key sectors, including a sharp halving of manufacturing growth to 2.6%. The mining, electricity, primary goods, and consumer goods sectors all witnessed contractions. Released by the Ministry of Statistics and Programme Implementation, the data highlights the drag on industrial momentum, partly attributed to the early onset of the monsoon affecting mining and power activities.
Key Points
- India's Index of Industrial Production (IIP) growth slumped to a 9-month low of 1.2% in May 2025.
- The slowdown was broad-based, with contractions seen in mining, electricity, primary goods, and consumer goods sectors.
- Manufacturing growth decelerated sharply to 2.6% in May 2025, compared to 5.1% in the same month the previous year.
- The early onset of the monsoon was cited as one of the factors affecting the performance of mining and power sectors.
- Data was released by the Ministry of Statistics and Programme Implementation (MoSPI).
Important Terms
Index of Industrial Production (IIP)

A monthly indicator measuring short-term changes in the volume of production of a basket of industrial products. It acts as a barometer for India's industrial sector performance.
UPSC context
GS Paper III (Economy); tests knowledge of macroeconomic indicators, their components, and their role in GDP estimation.
National Statistical Office (NSO)
The central agency under MoSPI responsible for compiling and releasing key macroeconomic data, including the IIP and CPI, following the merger of CSO and NSSO.
UPSC context
GS Paper II & III; tests understanding of India's institutional framework for official statistics and data dissemination.
Ministry of Statistics and Programme Implementation (MoSPI)
The nodal ministry responsible for the planned development of the statistical system and monitoring the implementation of major central government programs and infrastructure projects.
UPSC context
GS Paper II (Governance); involves executive oversight of national data quality and project monitoring mechanisms.
Eight Core Industries (ICI)
A group of eight foundational sectors—Refinery Products, Electricity, Steel, Coal, Crude Oil, Natural Gas, Cement, and Fertilizers—accounting for 40.27% of the IIP's weight.
UPSC context
GS Paper III (Industry); frequently tested in Prelims regarding sector weightage and industrial growth drivers.
Use-Based Classification
A secondary categorization of industrial products in the IIP into groups like Primary, Capital, Intermediate, Infrastructure/Construction, and Consumer Durables/Non-durables to analyze demand patterns.
UPSC context
GS Paper III (Economic Development); used to assess structural shifts and consumption trends within the industrial economy.
Manufacturing Sector
The largest broad sector component of the IIP, carrying a weightage of approximately 77.63% and serving as a critical indicator for factory-gate output.
UPSC context
GS Paper III (Industry); central to discussions on "Make in India" and sectoral economic growth.
Base Year
The reference period used to calculate growth in the IIP, currently set to 2011-12 to capture structural changes in the Indian economy.
UPSC context
GS Paper III (Economy); understanding the methodology of indices and the periodic need for rebasing macroeconomic data.
CareEdge Ratings
A major Indian credit rating and research agency that provides economic analysis and commentary on macroeconomic indicators and industrial trends.
UPSC context
GS Paper III (Economy); relevant for understanding the role of private rating agencies in analyzing economic data.
Prelims Trap
The Index of Eight Core Industries is compiled and released monthly by the National Statistical Office (NSO).
While NSO (MoSPI) releases the overall IIP, the Index of Eight Core Industries is released by the Office of Economic Adviser (OEA) under DPIIT.
Static Concepts Connected
What is the sectoral weightage breakdown of the IIP?
- Manufacturing: Holds the maximum weight in the index at approximately 77.6%.
- Mining & Electricity: Constitute the remaining broad sectors, holding ~14.4% and ~8% weights respectively.
- Eight Core Industries: Account for 40.27% of the total IIP weight. Refinery products hold the highest weight among these eight.
What are the use-based categories of the Index of Industrial Production?
- Capital Goods: Tracks machinery and plant equipment; serves as a crucial lead indicator for private sector capital expenditure and investment.
- Consumer Goods: Split into Durables (vehicles, appliances) and Non-durables (FMCG), reflecting urban and rural consumption demand.
- Primary & Intermediate: Includes unrefined raw materials (Primary) and partly finished products (Intermediate) used as inputs for final manufacturing.
Cross-Topic Patterns
Monsoon anomalies impacting macro-data
Early monsoons disrupt open-cast mining and lower electricity demand for cooling. This highlights how geographical and climate patterns directly skew high-frequency macroeconomic indices like the IIP.
Jobless growth & manufacturing stagnation
Manufacturing's chronic stagnation at ~15% of GDP, despite holding 77.6% of IIP weight, links directly to GS-3 debates on PLI scheme efficacy and India's 'jobless growth' phenomenon.

Expect a Prelims question mixing IIP use-based categories (Capital vs Consumer goods) with Core Sector weightages (Refinery vs Steel).
Linked PYQs · 3
Linked PYQs · 3
- 2015PrelimsGS1
In the 'Index of Eight Core Industries', which one of the following is given the highest weight?
- 2023MainsGS3
Faster economic growth requires increased share of the manufacturing sector in GDP, particularly of MSMEs. Comment on the present policies of the Government in this regard.
- 2022MainsGS3
Economic growth in the recent past has been led by increase in labour productivity." Explain this statement. Suggest the growth pattern that will lead to creation of more jobs without compromising labour productivity.
