Index of Industrial Production Growth Recovery and Manufacturing
Source:The Hindu ↗
Why It Matters
The IIP is a crucial high-frequency indicator of India's industrial health. Analyzing the varied performance of its components—such as capital goods indicating investment levels, and consumer durables reflecting consumption demand—helps in understanding macroeconomic trends, which is highly relevant for GS3 questions on economic growth and the manufacturing sector.
Summary
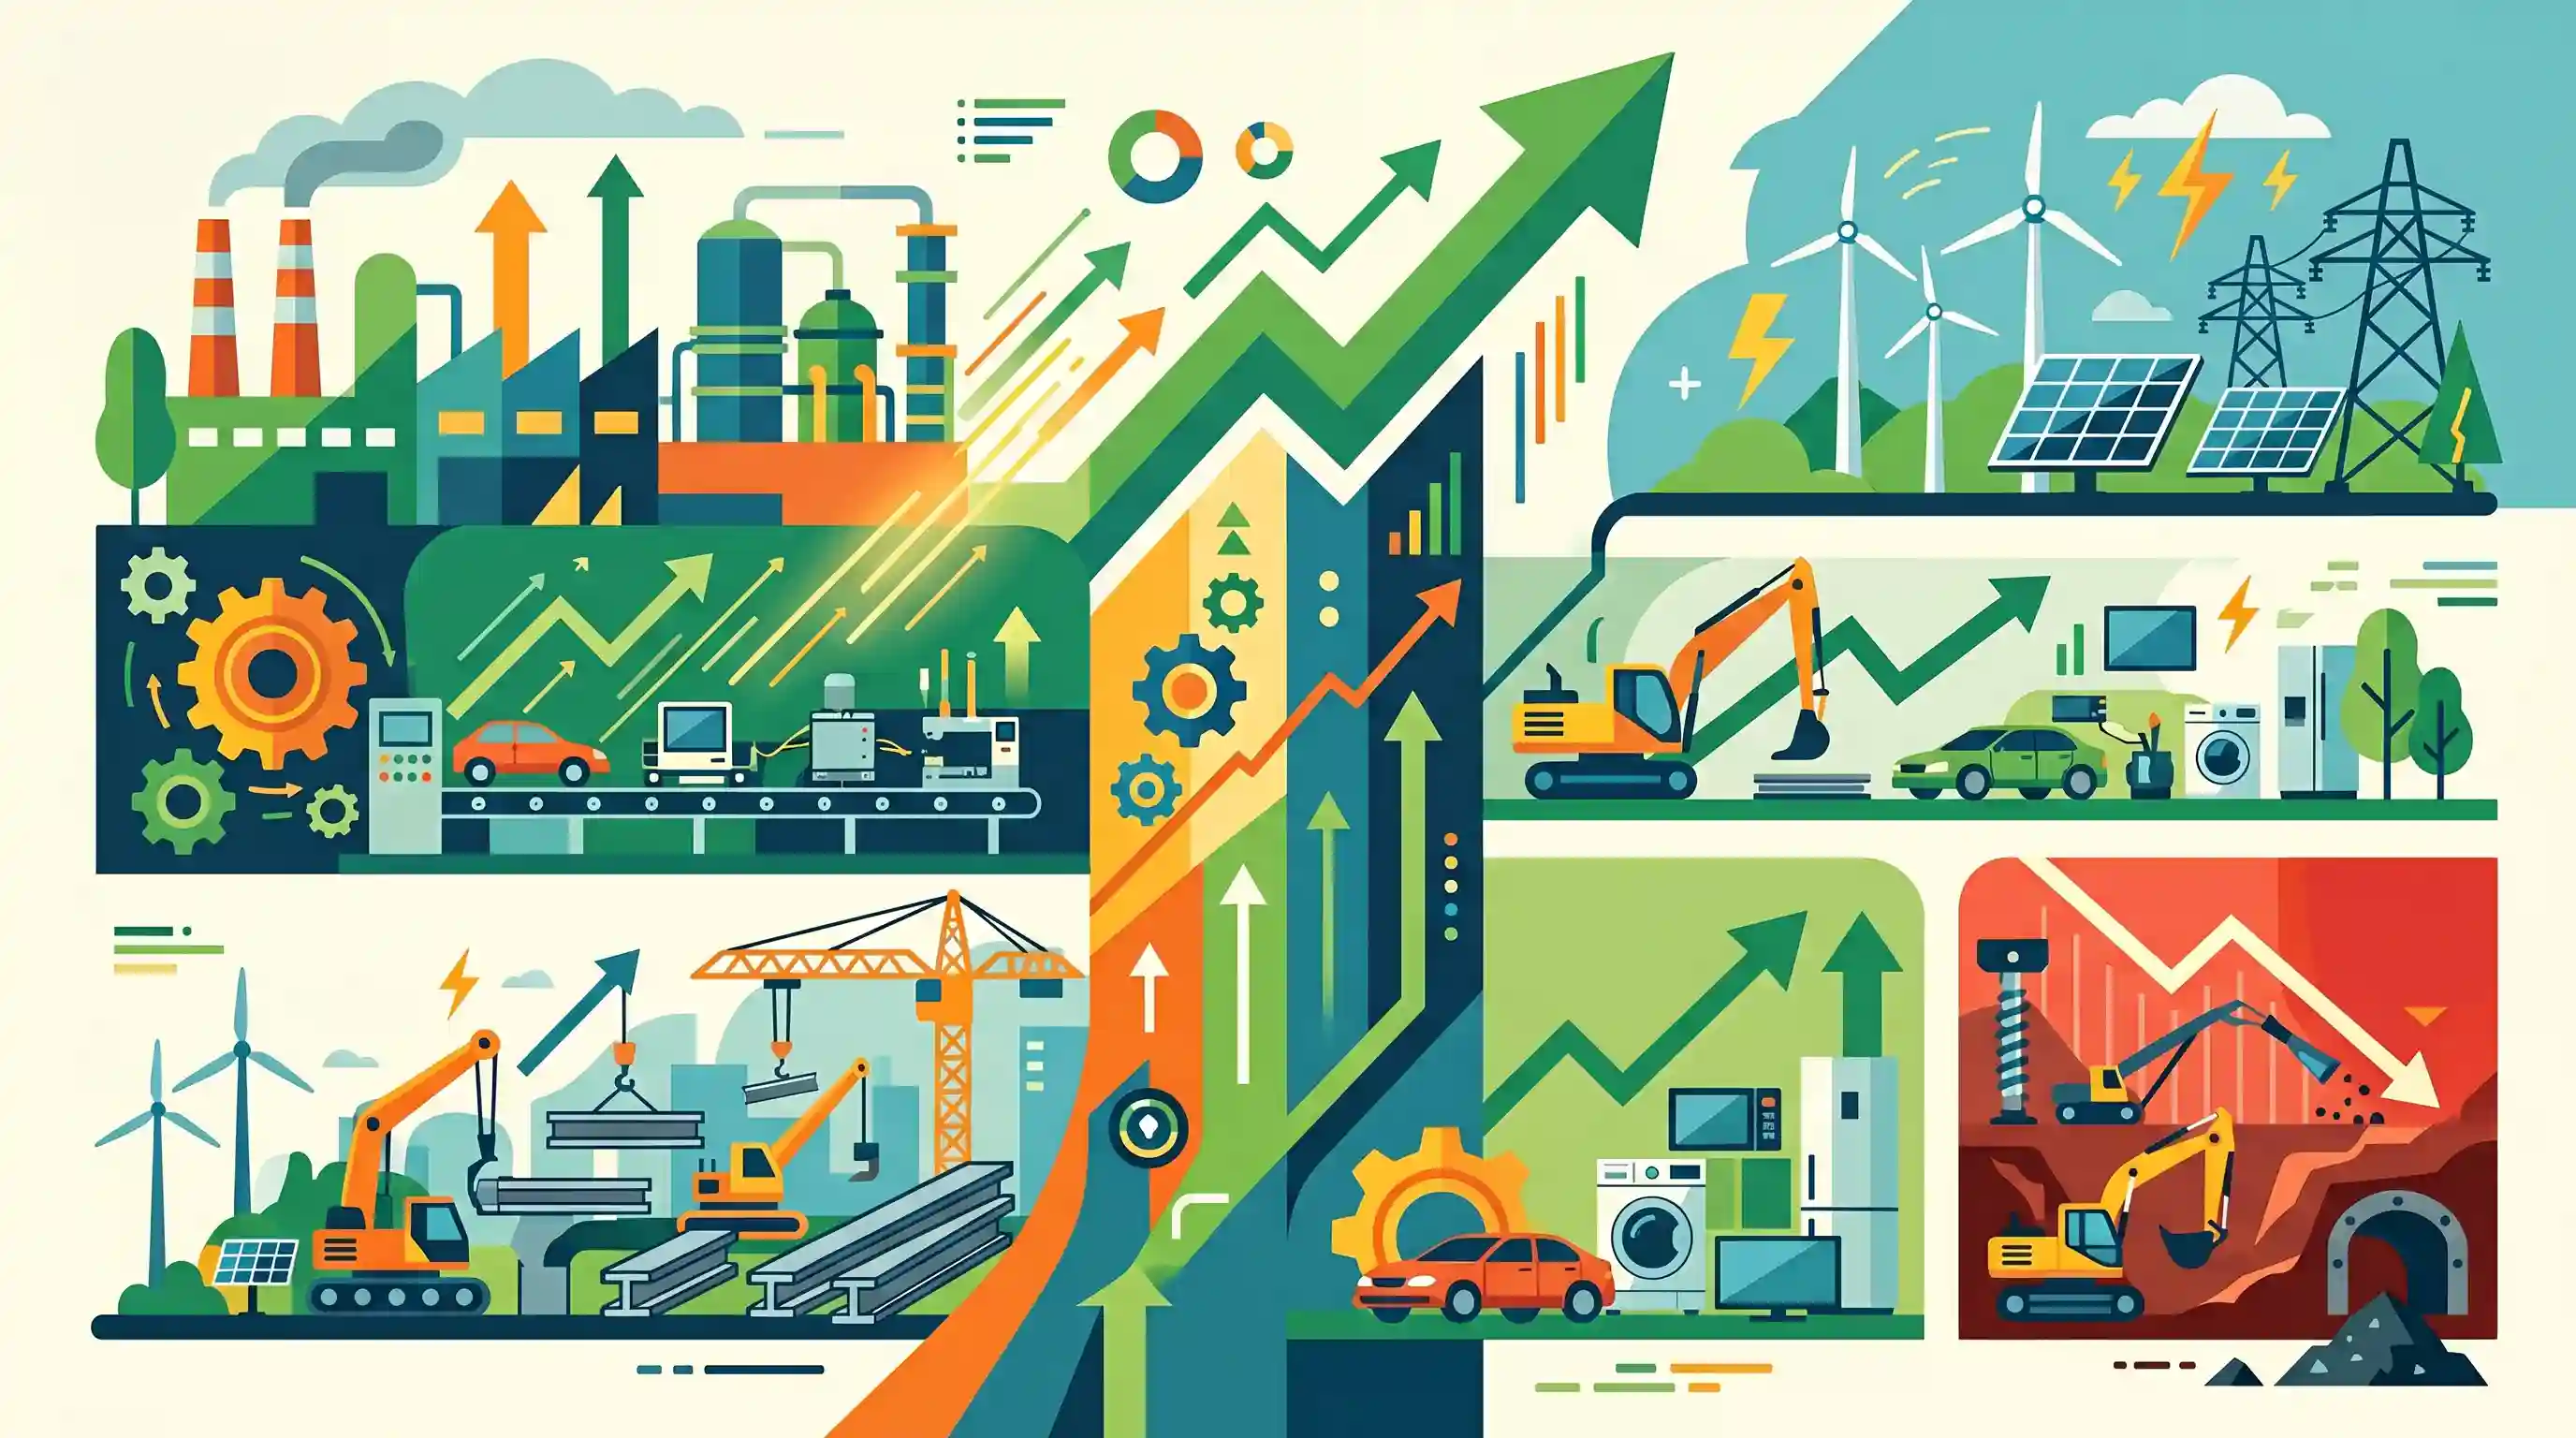
India's industrial output, measured by the Index of Industrial Production (IIP), rebounded to a four-month high of 3.5% in July 2025. The growth was broad-based, led by a strong 4.6% expansion in the manufacturing sector and robust electricity generation. The positive performance in capital goods and consumer durables highlights strengthening investment and consumption demand in the economy. However, this overall industrial recovery was slightly offset by a 1.7% contraction in the mining sector.
Key Points
- India's Index of Industrial Production (IIP) growth accelerated to a four-month high of 3.5% in July 2025.
- The manufacturing sector, which holds the highest weightage (77.6%) in the IIP, expanded by 4.6%.
- Capital goods output grew by 4.2%, and consumer durables registered a growth of 6.2%, signaling revivals in both investment and consumption demand.
- Electricity generation continued its robust performance with a 7.1% increase.
- The mining sector acted as a drag on the overall index, contracting by 1.7% during the month.
Important Terms
Index of Industrial Production (IIP)

A monthly index measuring the short-term growth rate of industrial production volume across Mining, Manufacturing, and Electricity sectors, using the 2011-12 base year.
UPSC context
GS Paper 3: Indian Economy. Key indicator for industrial performance, GDP calculation, and monetary policy decisions.
Ministry of Statistics and Programme Implementation (MoSPI)
The parent ministry responsible for compiling and disseminating national statistics, including IIP, GDP, and CPI, through the National Statistical Office (NSO).
UPSC context
GS Paper 3: Institutional framework. Essential for understanding the official sources of macroeconomic data.
National Statistical Office (NSO)
The primary statistical agency of the Indian government, formed by merging the CSO and NSSO, responsible for publishing the IIP every month.
UPSC context
GS Paper 3: Economic Growth. Tests knowledge of the institutional machinery behind national data collection.
Capital Goods
Tangible assets like machinery and equipment used to produce other goods. In the IIP, its growth serves as a proxy for investment demand.
UPSC context
GS Paper 3: Investment Models. Indicates Gross Fixed Capital Formation and future industrial capacity.
Consumer Durables
Manufactured products with a lifespan of 3+ years (e.g., appliances). Growth in this IIP use-based category signifies strengthening domestic consumption demand.
UPSC context
GS Paper 3: Indian Economy. Used to assess consumer sentiment and purchasing power in the economy.
Manufacturing Sector (IIP)
The largest broad sector in the IIP with a weight of 77.63%. Its performance typically dictates the overall direction of the industrial index.
UPSC context
GS Paper 3: Industrial Growth. Focuses on the structural composition and sector-specific weightages of industrial indices.
Prelims Trap
"The Eight Core Industries account for more than 50% of the total weight of the Index of Industrial Production (IIP)."
The Eight Core Industries comprise exactly 40.27% of the IIP, not a majority. UPSC frequently exaggerates this percentage or swaps the highest sector weightages to trap candidates.
Static Concepts Connected
What are the broad sectors of the IIP and their relative weightages?
- Manufacturing (Highest): Manufacturing dominates the index with a massive 77.63% weightage.
- Mining (Second): Mining holds the second position with a 14.37% weightage in the index.
- Electricity (Lowest): Electricity generation holds the lowest weightage among the broad sectors at 7.99%.
- Compilation & Base: The index is compiled monthly by the National Statistical Office (NSO) with a base year of 2011-12.
How is the Use-Based Classification of the IIP structured?
- Six Categories: It divides output into Primary Goods, Capital Goods, Intermediate Goods, Infrastructure, Consumer Durables, and Consumer Non-Durables.
- Primary Goods Dominance: Unlike the broad sector classification where Manufacturing leads, Primary Goods hold the highest weightage in the use-based framework.
Cross-Topic Patterns
IIP vs. PMI (Purchasing Managers' Index)
While IIP measures actual physical production volume published by the NSO (lagging indicator), PMI is a private survey-based sentiment index (leading indicator). UPSC often tests the conceptual difference between the two.
Capital Goods & GFCF linkage
A sustained rise in the 'capital goods' segment of the IIP acts as a strong proxy for an expanding Gross Fixed Capital Formation (GFCF), indicating private capex recovery in GDP calculations.

Expect a Prelims question contrasting IIP's volume-based data with PMI's sentiment index, specifically targeting core sector weightages.
Linked PYQs · 2
Linked PYQs · 2
- 2012PrelimsGS1
In India, in the overall Index of Industrial Production, the Indices of Eight Core Industries have a combined weight of 37.90%. Which of the following are among those Eight Core Industries? 1. Cement 2. Fertilizers 3. Natural gas 4. Refinery products 5. Textiles Select the correct answer using the codes given below:
- 2023MainsGS3
Faster economic growth requires increased share of the manufacturing sector in GDP, particularly of MSMEs. Comment on the present policies of the Government in this regard.
