Bihar Economic Survey Highlights High Growth With Low Income
Source:newindianexpress ↗
Why It Matters
Essential for BPSC aspirants tracking Bihar's specific socio-economic indicators, state economic surveys, GSDP growth trends, and regional development paradoxes.
Summary
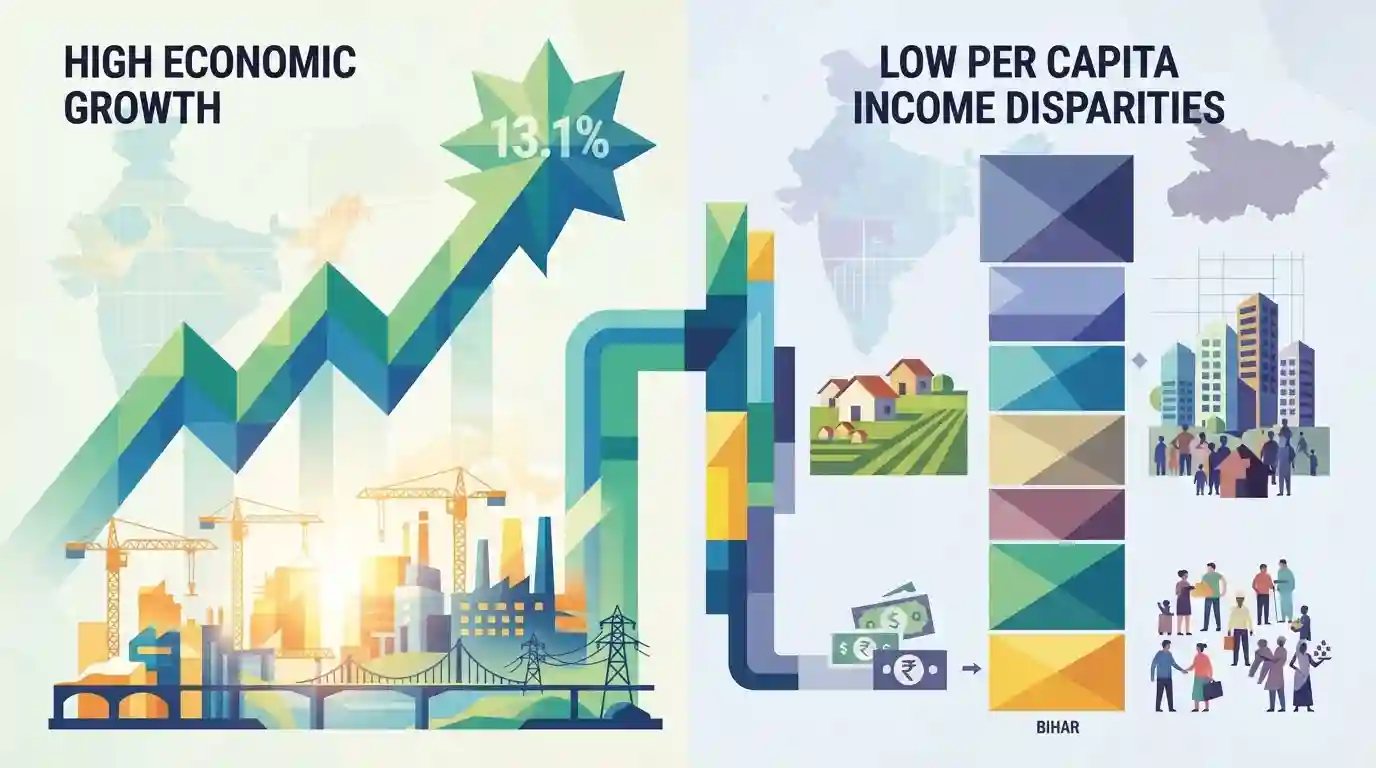
According to the latest Bihar Economic Survey, the state posted an impressive 13.1% growth rate, reflecting robust expansion in its Gross State Domestic Product (GSDP). However, despite this high growth momentum, Bihar's per capita income continues to remain the lowest in the country, underscoring persistent income disparities and developmental challenges.
Key Points
- Bihar recorded a strong GSDP growth rate of 13.1%, indicating rapid expansion in economic output.
- Despite the impressive macro growth rate, Bihar's per capita income continues to remain the lowest among all Indian states.
- The findings highlight the persistent gap between overall state economic growth and individual wealth distribution or regional income disparities in India.
Important Terms
Economic Survey of Bihar

An annual official document presented by the state government detailing Bihar's macroeconomic performance, sectoral growth trends, fiscal indicators, and development challenges for the preceding financial year.
UPSC context
Crucial for BPSC Prelims and Mains (General Studies Paper II - Indian Economy and Bihar Economy), testing data analysis and state-level socioeconomic indicators.
Gross State Domestic Product (GSDP)
The total monetary value of all finished goods and services produced within Bihar's geographical boundaries over a specific financial year, reflecting the state's overall economic expansion.
UPSC context
Important for BPSC economics questions regarding state growth rates, regional disparities, and comparative economic performance against national averages.
Per Capita Income (Bihar)
A metric calculated by dividing the total Gross State Domestic Product by the state's total population, indicating the average economic output or income per person in Bihar.
UPSC context
Frequently asked in BPSC Prelims and Mains under development economics, poverty alleviation, and regional income inequality topics.
Prelims Trap
Bihar's impressive 13.1% GSDP growth means its per capita income has now surpassed the national average.
Aspirants often assume high percentage GSDP growth automatically translates to a higher relative rank in per capita income across states, missing the baseline effect and population denominator.
Static Concepts Connected
What are the key structural features and regional disparities highlighted in recent Bihar Economic Surveys?
- Macro Growth: High GSDP Growth: Bihar has consistently registered impressive macro-level GSDP growth rates (often exceeding 10-13%), driven largely by the tertiary and secondary sectors.
- Per Capita Income: Lowest Per Capita: Despite strong output growth, Bihar consistently ranks lowest in per capita income among all Indian states due to high population density and a low base.
- District Disparity: Inter-District Gap: Stark disparities exist within the state; Patna consistently records the highest per capita GSDP, while districts like Sheohar or Kishanganj record the lowest.
- CapEx Focus: Capital Expenditure: Recent surveys show an increased emphasis on capital expenditure (infrastructure, roads, power) as a share of total state budget outlays.
Cross-Topic Patterns
Growth Paradox & Regional Disparities
Bihar's high macro GSDP growth coexisting with lowest per capita income illustrates the 'growth without inclusive development' paradox seen across several developing federal states.
Intra-State Inequality & Geography
Inter-district variations (Patna vs Sheohar) mirror broader national North-South or coastal-hinterland development divides studied in economic geography.

Bihar GSDP growth vs per capita income ranking will feature as a data-driven statement in BPSC Prelims or Mains GS-2.
Linked PYQs · 3
Linked PYQs · 3
- 2025BPSC_PRELIMSGS1
Which of the following statement/s is/are correct about Bihar’s economic performance in 2023-24?
- 2023BPSC_PRELIMSGS1
According to the Bihar Economic Survey (2021–2022), what was the rate of growth of Gross State Domestic Product (GSDP) of Bihar in 2020–2021?
- 2024-IBPSC_PRELIMSGS1
The 60.2 percent share in GSDP of Bihar in 2019 – 20 was of
