Bihar Economic Survey and Macroeconomic Indicators
Source:drishtiias ↗
Why It Matters
The Bihar Economic Survey is a core document frequently tested in BPSC Prelims, providing direct factual questions regarding GSDP growth rates, sectoral shares (services, agriculture, industry), and per capita income figures.
Summary
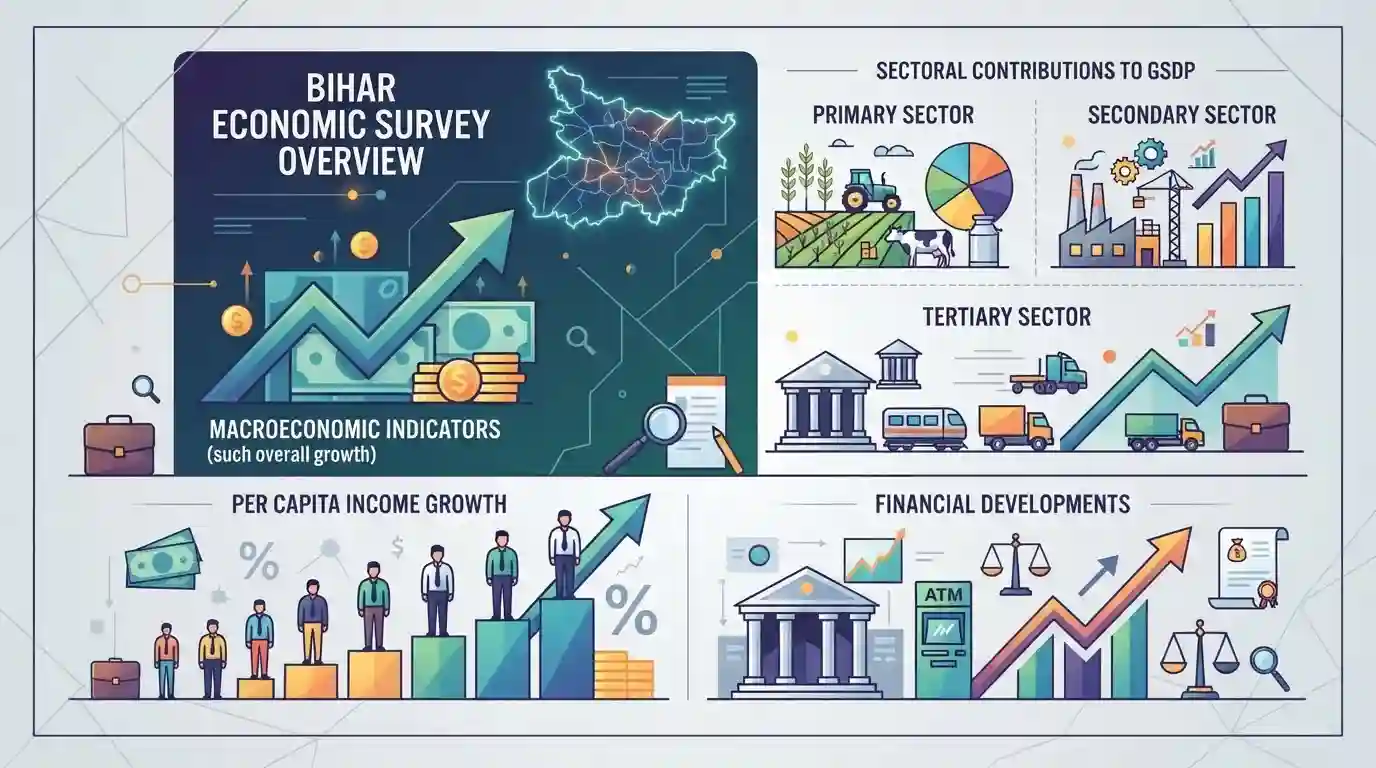
An overview of the Bihar Economic Survey highlights major macroeconomic indicators, sectoral contributions to GSDP, per capita income growth, and financial developments in Bihar, which are vital for state-level civil services examinations.
Key Points
- The Bihar Economic Survey provides comprehensive data on the state's Gross State Domestic Product (GSDP) growth, sectoral distribution (primary, secondary, and tertiary/service sector), and per capita income trends.
- It highlights key fiscal parameters, government expenditures on social and economic sectors, and developmental indicators essential for tracking Bihar's economic trajectory.
- The service sector typically holds the largest share in Bihar's GSDP, while agriculture and allied sectors remain crucial for employment and rural livelihood.
Important Terms
Bihar Economic Survey

An annual statutory document presented by the state government detailing macroeconomic indicators, sectoral contributions to GSDP, fiscal performance, and welfare outcomes of Bihar’s economy.
UPSC context
BPSC Paper II (Economics/Geography) - tests factual data and analytical understanding of Bihar's growth rate, GSDP, and per capita income.
Gross State Domestic Product (GSDP)
The total market value of all finished goods and services produced within Bihar in a specific financial year, serving as the core metric for state economic growth.
UPSC context
BPSC Economics section - frequently asked questions on GSDP growth rate, comparison with national GDP, and sectoral shares (primary, secondary, tertiary).
Per Capita Income (Bihar)
The average income earned by each individual in the state, calculated by dividing the Net State Domestic Product by the total population.
UPSC context
BPSC Prelims and Mains - crucial for questions addressing the economic paradox of high GSDP growth vs. lowest per capita income nationally.
Sectoral Contributions to GSDP
The division of Bihar's economy into agriculture and allied sectors (primary), manufacturing and industry (secondary), and services (tertiary), tracking relative shares in GSDP.
UPSC context
BPSC Economics - tests structural changes in Bihar's economy, particularly the dominance of the tertiary sector and industrial lag.
Prelims Trap
Bihar's per capita income now exceeds the national average due to its consistently high GSDP growth rate outperforming national figures.
Aspirants often assume that because Bihar's GSDP growth rate has outperformed the national average, its per capita income has also surpassed the national average. In reality, per capita income remains well below the national average.
Static Concepts Connected
What are the structural sectoral contributions and growth trends in Bihar's GSDP according to recent surveys?
- Service Sector Share: Tertiary Dominance: The service sector contributes the largest share to Bihar's Gross State Domestic Product (GSDP).
- Primary Sector Role: Primary Reliance: Agriculture and allied sectors employ the majority of the workforce despite a smaller relative share in overall GSDP.
- Secondary Sector Deficit: Industrial Lag: The secondary (manufacturing and industrial) sector historically records the lowest share among the three major economic sectors in Bihar.
Cross-Topic Patterns
GSDP Growth vs. Per Capita Income Paradox
Bihar's high GSDP growth rate running parallel with the lowest per capita income nationally tests aspirants on the paradox between aggregate macro output and individual welfare distribution.
State Fiscal Deficits & Finance Commission Devolution
Connecting state fiscal parameters like revenue deficit and capital outlay with central devolution under the Finance Commission recommendations for backward states.

Expect a 2-statement Prelims question contrasting Bihar's high GSDP growth rate with its low national per capita income ranking.
Linked PYQs · 3
Linked PYQs · 3
- 2024-IBPSC_PRELIMSGS1
The 60.2 percent share in GSDP of Bihar in 2019 – 20 was of
- 2025BPSC_PRELIMSGS1
Which of the following statement/s is/are correct about Bihar’s economic performance in 2023-24?
- 2023BPSC_PRELIMSGS1
According to the Bihar Economic Survey (2021–2022), what was the rate of growth of Gross State Domestic Product (GSDP) of Bihar in 2020–2021?
